
Demographic Analysis of Aging and Longevity
Prof. James W. Vaupel, Ph.D.
Max Planck Institute for Demographic Research
Konrad-Zuse-Strasse 1, D-18057 Rostock, Germany
XXIIIrd IUSSP General Population Conference
Beijing, China
Second Plenary Session
17 October 1997
© 1997 by James W. Vaupel, Max Planck Institute for Demographic Research
Figures
Figure 1: The Location of Demography in the World of Knowledge.

Figure 2: Improvements in Mortality from 1900 through 1992 in Sweden for Females Aged 85, 90, and 95.

Note: m denotes the central death rate. Source: Compiled by author from data in the Kannisto-Thatcher Oldest-Old Database, Odense University, Denmark (Kannisto 1994).
Figure 3: Mortality Reductions since 1950 for Female Octogenarians and Nonagenarians in England & Wales, France, Sweden, and Japan.
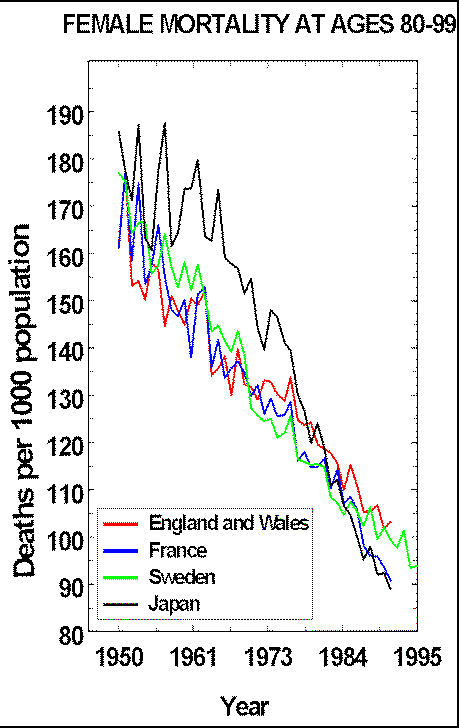
Note: m denotes central death rates. Source: Same as Figure 2.
Figure 4: Average Annual Improvement in Mortality Between Successive Five-Year Periods, for Male and Female Octogenarians and Nonagenarians, in an Aggregation of 10 Countries.
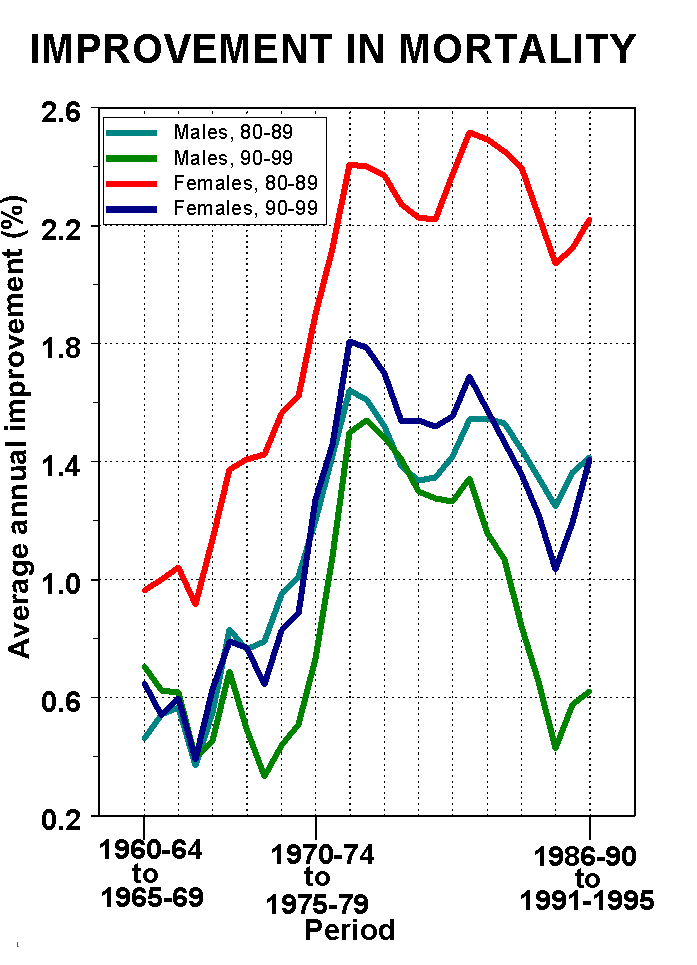
Source: Same as Figure 2. See Kannisto et al. (1994) for method of calculation. The 10 countries are: Austria, Denmark, Finland, Germany, Iceland, Italy, Japan, Norway, Sweden, and Switzerland.
Figure 5: Average Central Death Rate in the 1970s Compared with Average Annual Improvement in Mortality from the 1970s to the 1980s, for Males and Females, for Ages 80-99 Combined.

Note: The subscripts f and m stand for female and male. The capital letters represent countries as follows: A, Austria; Au, Australia; Dk, Denmark; Ew, England & Wales; Sf, Finland; F, France; H, Hungary; J, Japan; and S, Sweden. Source: Same as Figure 2; also see Kannisto et al. (1994).
Figure 6: Mortality in England & Wales, Japan, the United States, and Two U.S. Regions—the Upper Midwest and the Deep South—from Age 80 to 99 in 1980-1989.
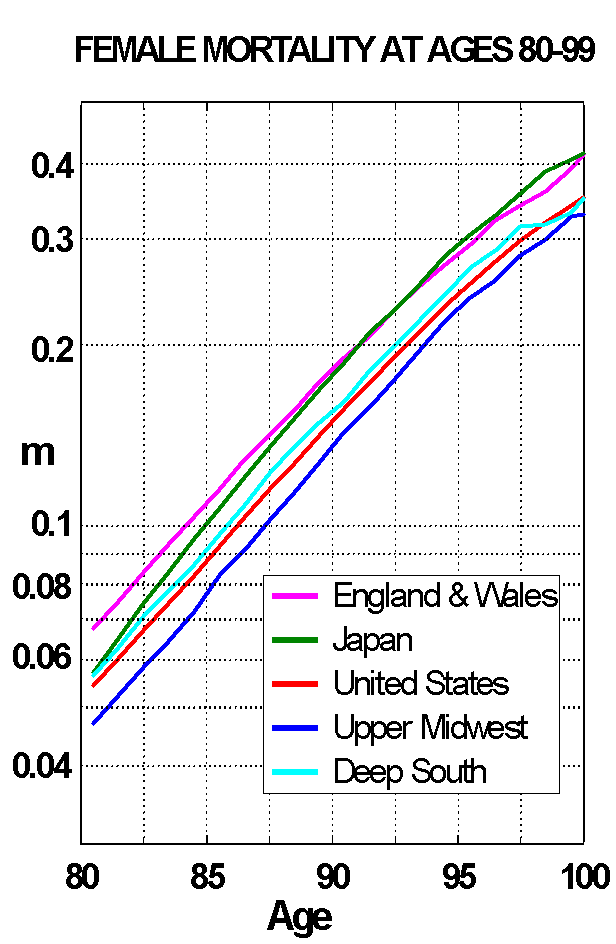
Note: m denotes central death rates. For the United States the figures pertain to the white population. The Upper Midwest includes Minnesota and North and South Dakota. The Deep South includes Arkansas, Louisiana, Alabama, and Mississippi. People are classified by the region in which they were living when they received their Social Security numbers. Source: For England & Wales and Sweden, same as Figure 2. For the United States and the two U.S. regions, compiled by the author from data provided by the U.S. Health Care Financing Administration.
Figure 7: Male Central Death Rates for Twins and the General Population Born in Denmark 1870-1900.
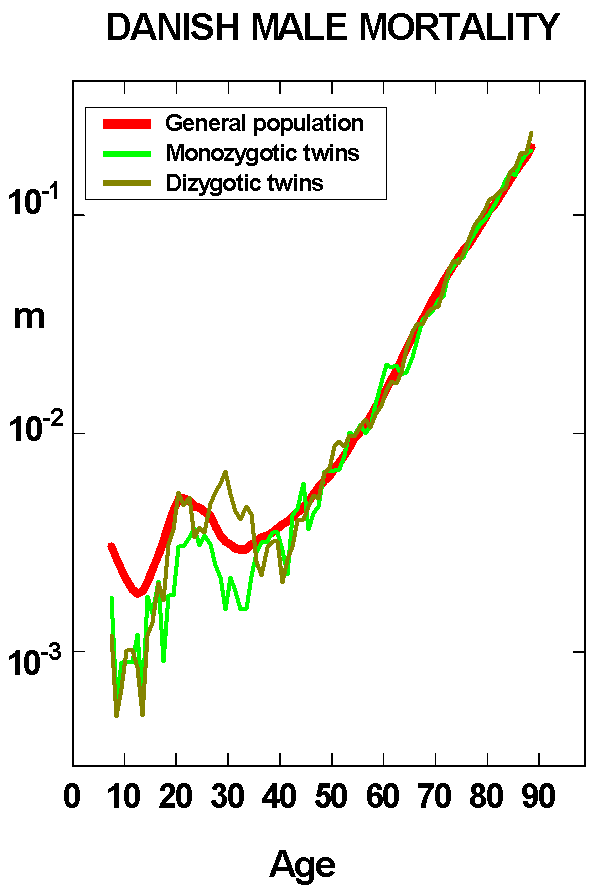
Source: Christensen et al. (1995).
Figure 8: Survival Ratio from Age 17 to 60 and Years Lived after Ages 60 and 80 for Finnish Cohorts Born before, during, and after Famine of 1866-1869.
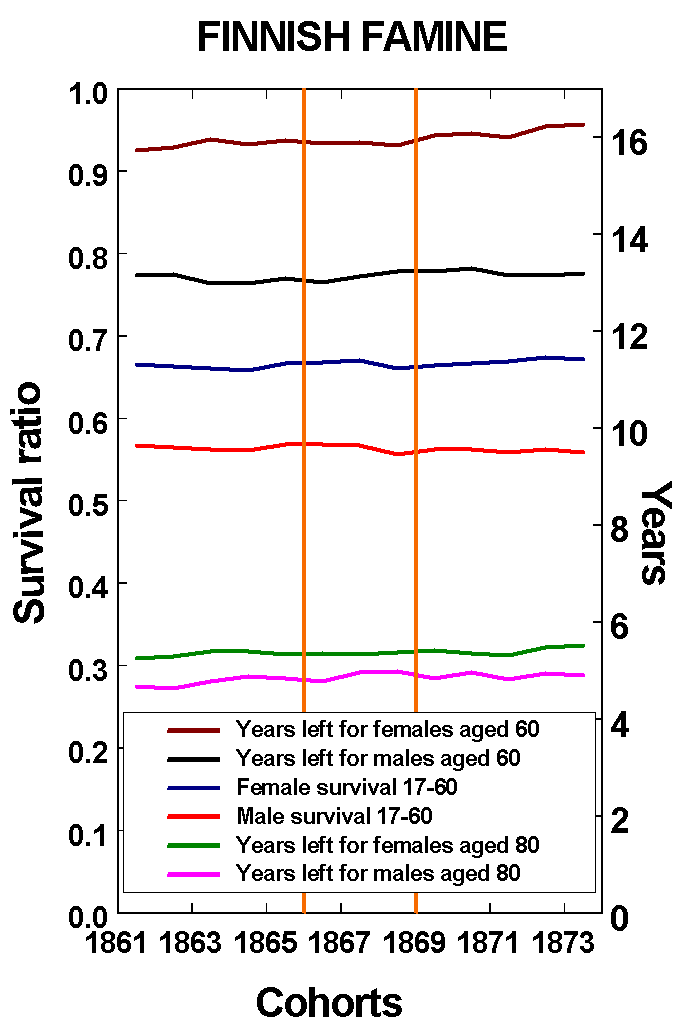
Source: Adapted from Kannisto, Christensen and Vaupel (1997).
Figure 9: Female Central Death Rates at Ages 80 and Over, 1980-1992, for Aggregation of 14 Countries.
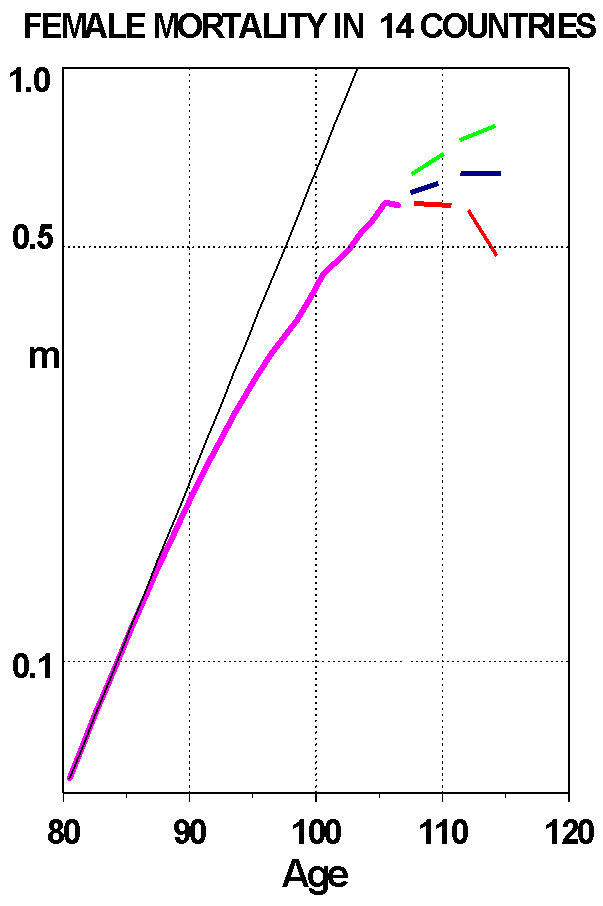
Source: Compiled by author from data in the Kannisto-Thatcher Oldest-Old Database, Odense University, Denmark. The 14 countries are: Austria Belgium, Denmark, Enagland & Wales, Finland, France, Germany, Iceland, Italy, Japan, Netherlands, Norway, Sweden, and Switzerland.
Figure 10: Daily Central Death Rates for 1.2 Million Medflies from Emergence to Age 100 Days.
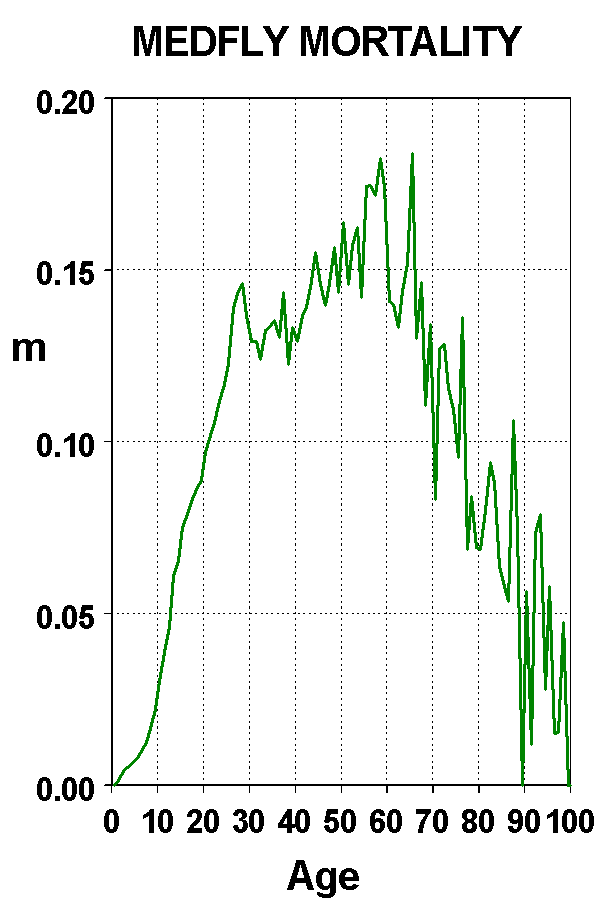
Source: Carey et al. (1992).
Figure 11: Central Death Rates for Chevrolets and Toyotas, 1970 and 1980 Model Years.
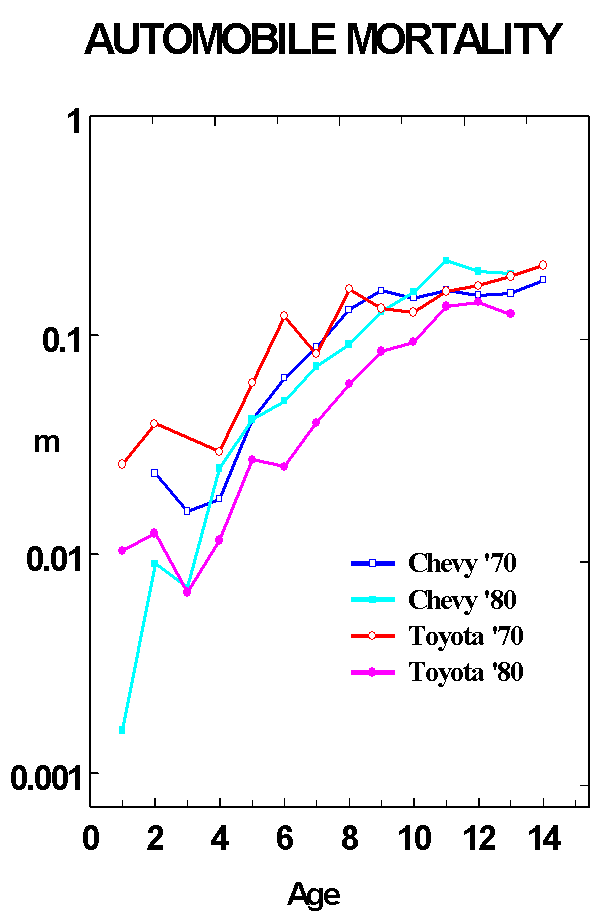
Source: Vaupel (1997).