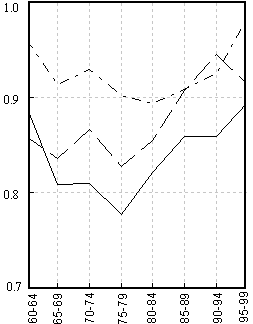
Figure 5. Relative change of mortality by age and sex |
|
from 1955-59 to 1985-89. |
|
Data below age 80 are based on U.N. Demographic Yearbook. |
|
Males |
Females |
|
|
|
|
|
 |
Figure 5. Relative change of mortality by age and sex |
|
from 1955-59 to 1985-89. |
|
Data below age 80 are based on U.N. Demographic Yearbook. |
|
Males |
Females |
|
|
|
|
|
 |