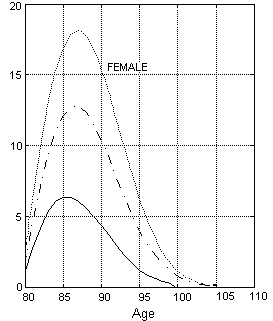
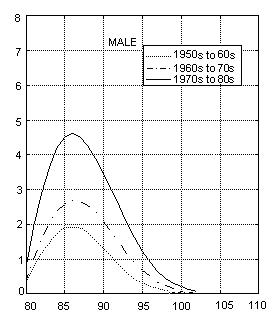
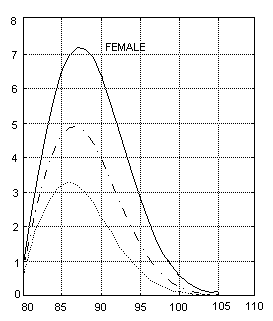
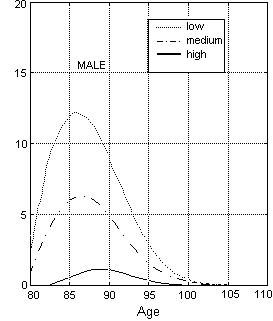
Figure 30.
YEARS OF LIFE GAINED PER 100 PERSONS AGED 80.
Top: Thirteen countries, intervals between successive decades.
Bottom: Low, medium and high mortality countries, between 1950-60 and 1980-90.