List of figures
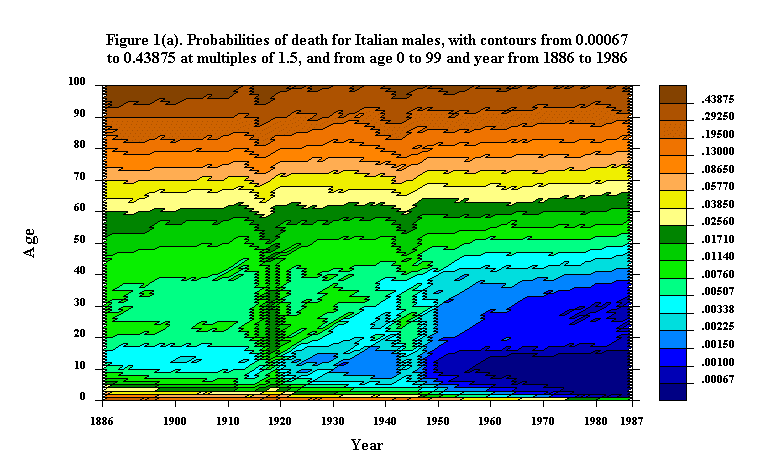
Figure 1. Probabilities of death for Italian males, from age 0 to 99 and year 1886 to 1986
b. As Figure 1(a), but in black and white
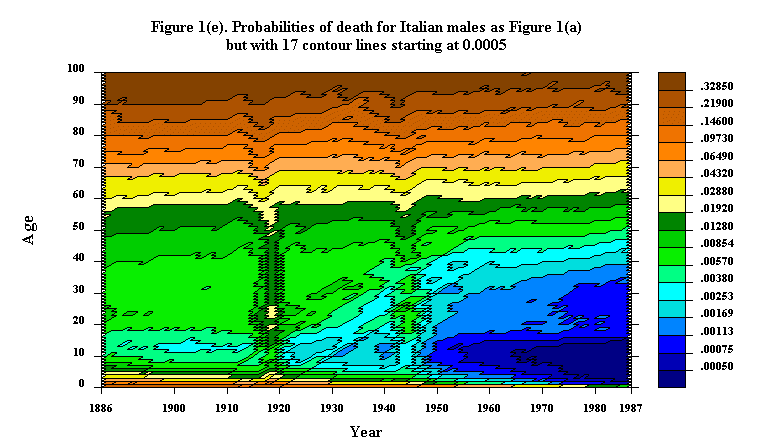
e. As Figure 1(b), but with 17 contour lines
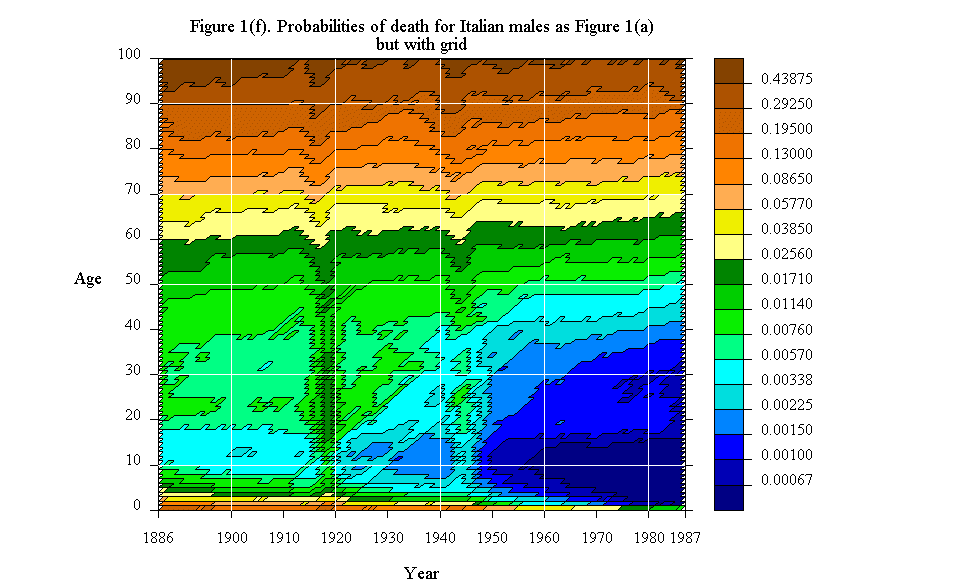
f. As Figure 1(b), but with a grid
g. As Figure 1(b), but without contour lines
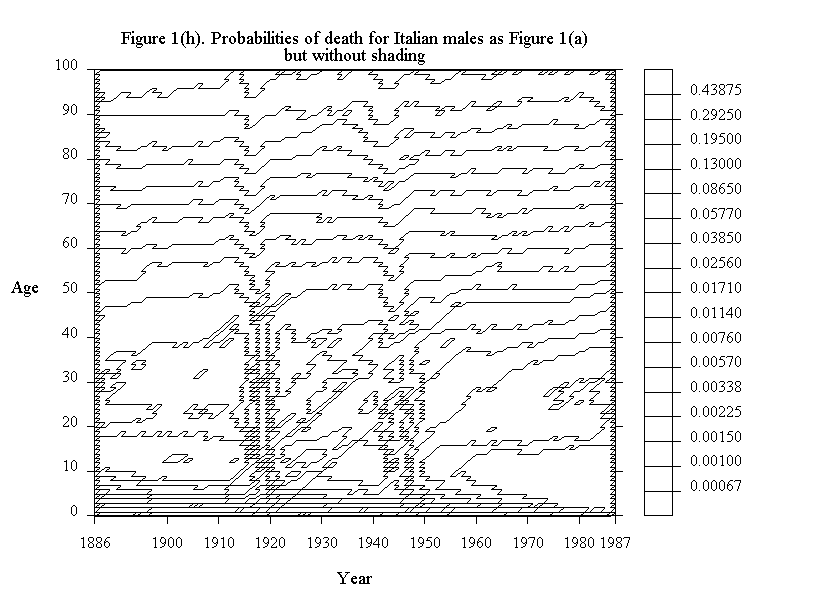
h. As Figure 1(b), but without shading
i. As Figure 1(b), but smoothed on a 5 x 5 square
j. As Figure 1(b), but smoothed on a 11 x 11 square
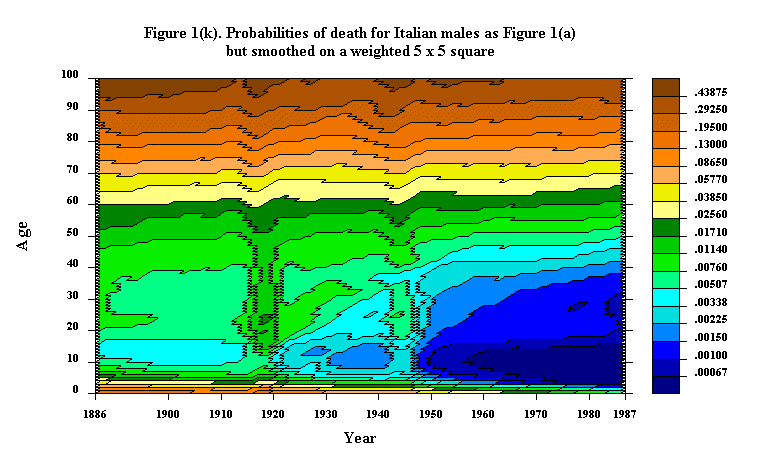
k. As Figure 1(b), but smoothed on a weighted 5 x 5 square
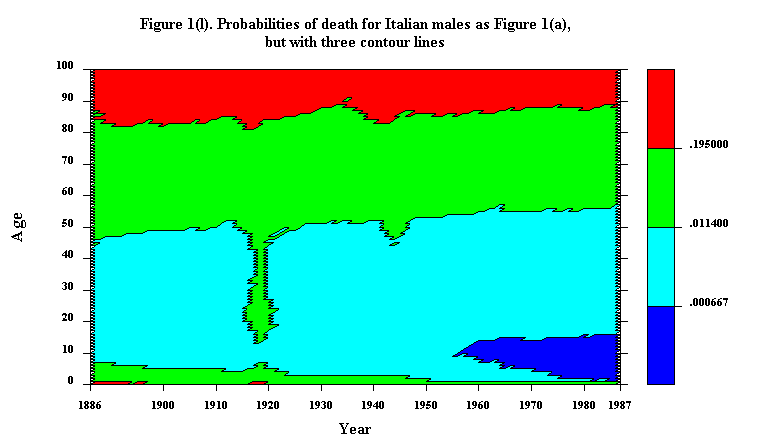
l. As Figure 1(b), but with only three contour lines
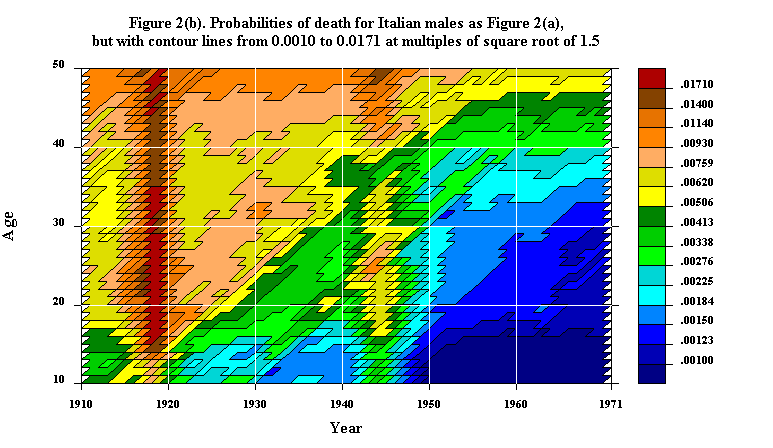
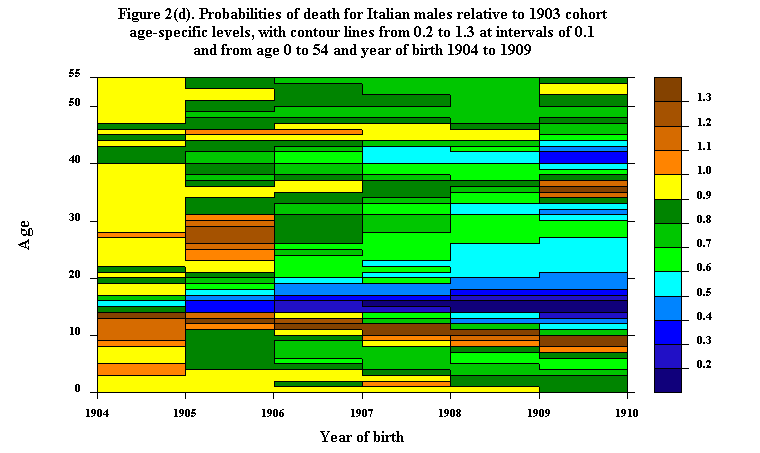
Figure 2. Probabilities of death for Italian males
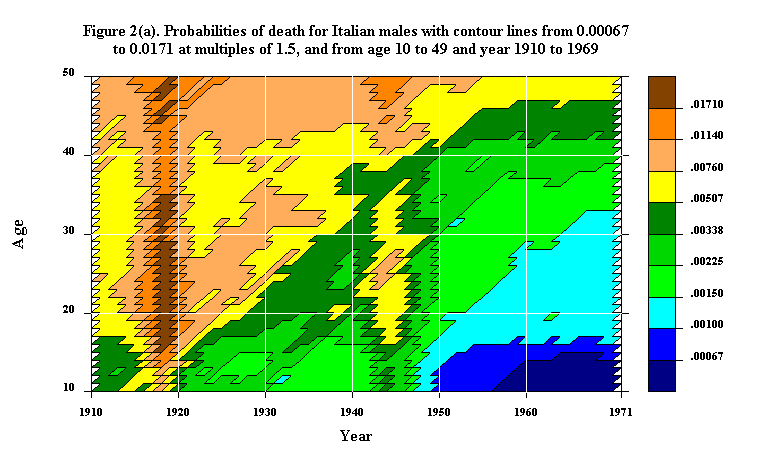
a. With a grid, from age 10 to 49 and year 1910 to 1969
b. As Figure 2(a), but with different contour lines
c. For cohorts, from age 0 to 54 and year of birth 1894 to 1924
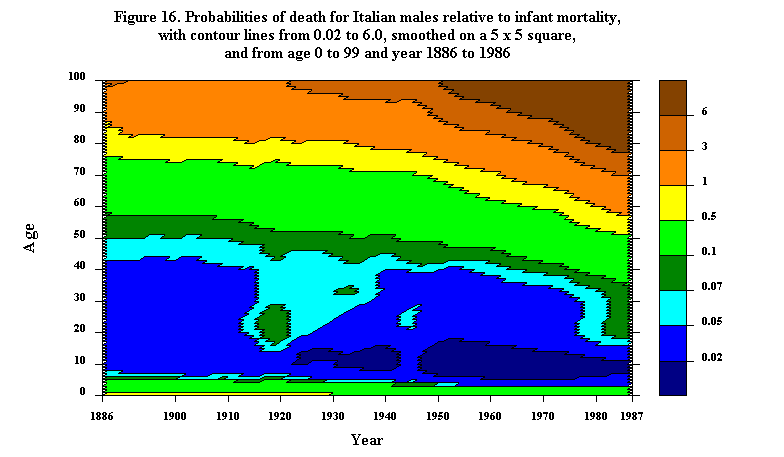
Figure 3. Probabilities of death for Italian males, from age 0 to 79 and year 1881 to 1964
b. Single-year-of-time-and-age data
Figure 4. Probabilities of death for Swedish females, from age 0 to 79 and year 1778 to 1993
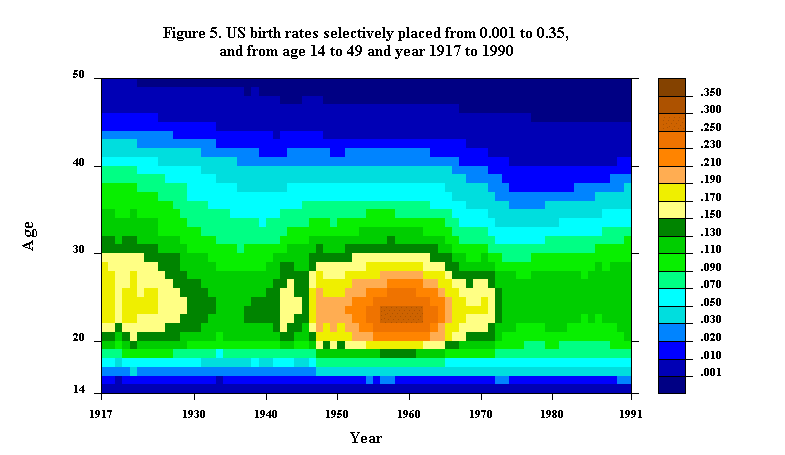
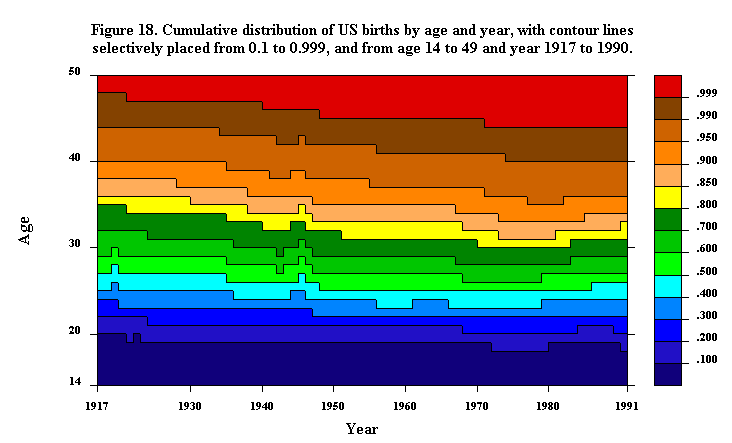
Figure 5. US birth rates, from age 14 to 49 and year 1917 to 1990
Figure 6. US cohort birth rates, from age 14 to 49 and year of birth 1867 to 1977
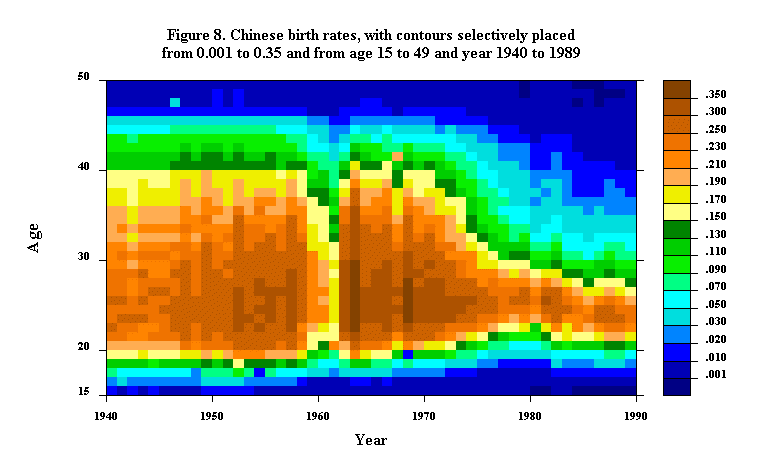
Figure 8. Chinese birth rates, from age 15 to 49 and year 1940 to 1989
Figure 9. Finnish birth rates, from age 15 to 49 and year 1776 to 1970
Figure 10. Alternative graphic displays of US birth rates 46
a. US birth rates from year 1917 to 1990 at ages 18, 23, and 28
b. US birth rates from age 14 to 49 in years 1920, 1950, and 1980
c. Three-dimensional perspective for ages 14 to 49 and years 1917 to 1990
Figure 11. Three-dimensional plots of US birth rates
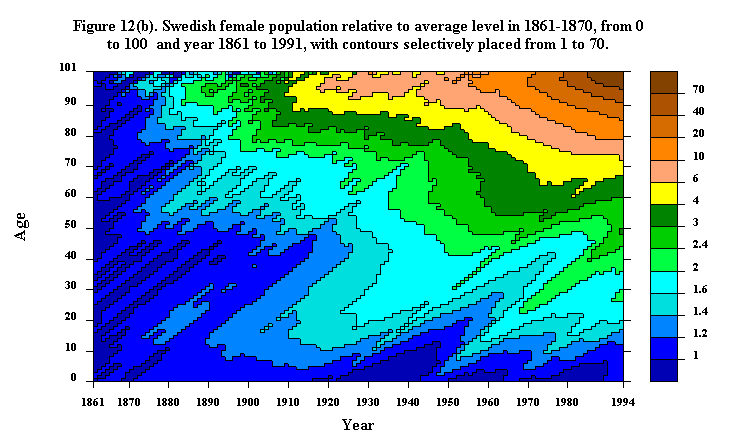
Figure 12. Swedish female population from year 1861 to 1993
a. Population from age 0 to 111
b. Population relative to average level in 1861-1870, from age 0 to 100
Figure 13. Japanese female population from age 80 to 116 and year 1950 to 1991
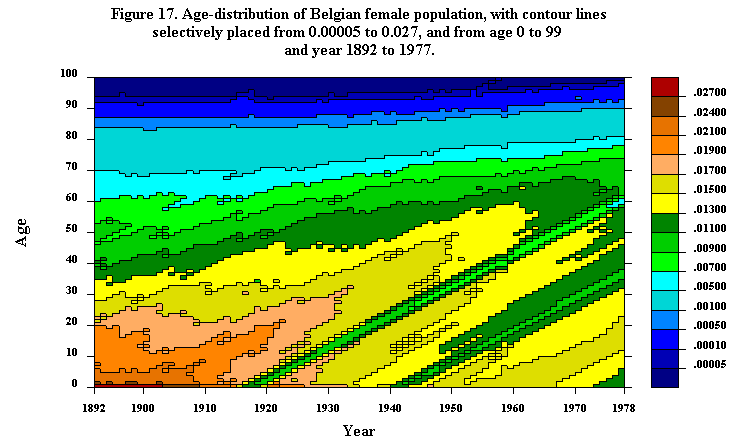
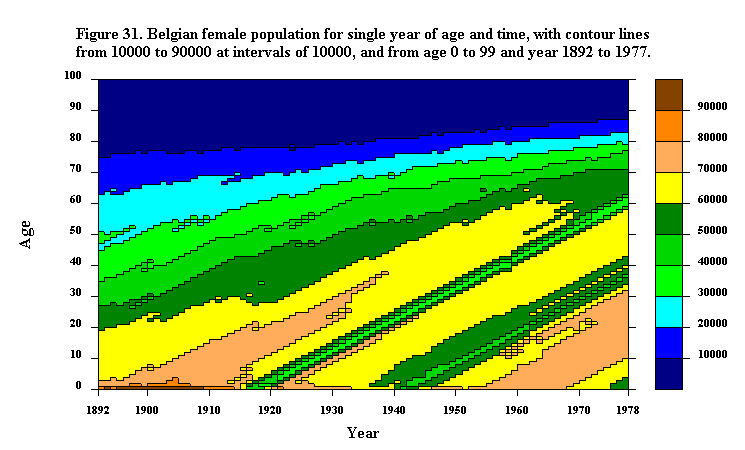
Figure 17. Age-distribution of Belgian female population, from age 0 to 99 and year 1892 to 1977
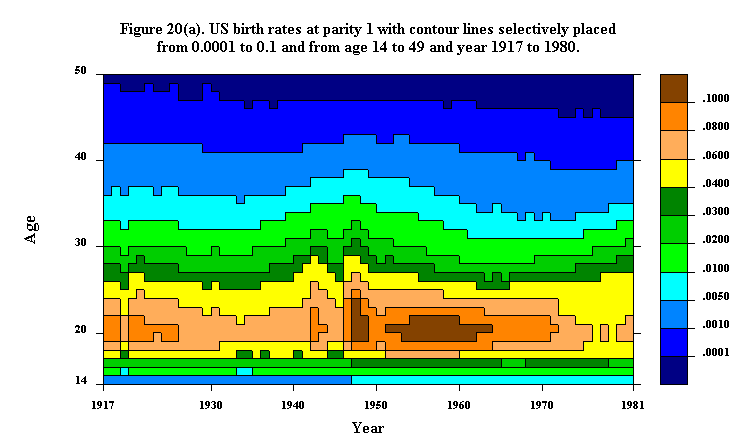
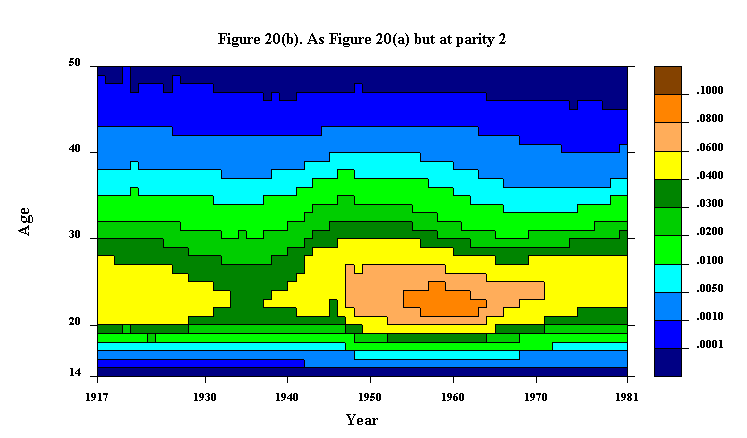
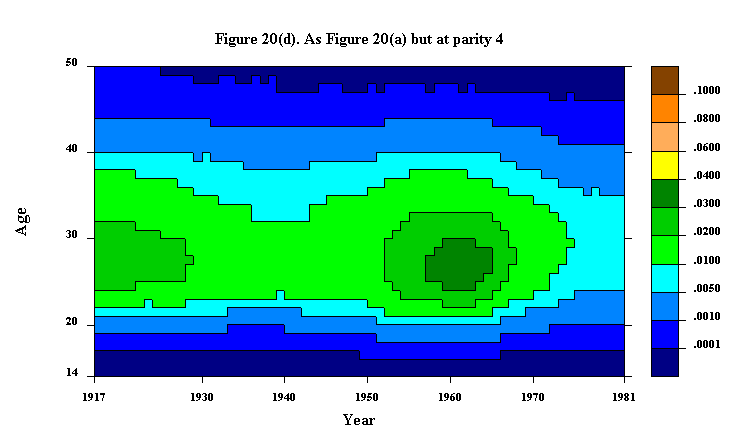
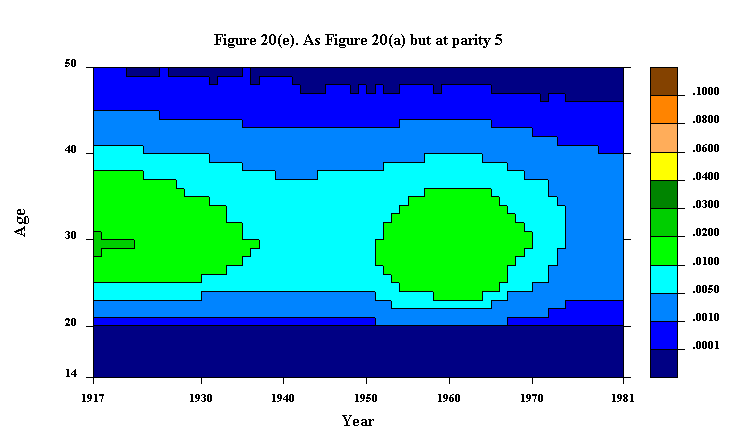
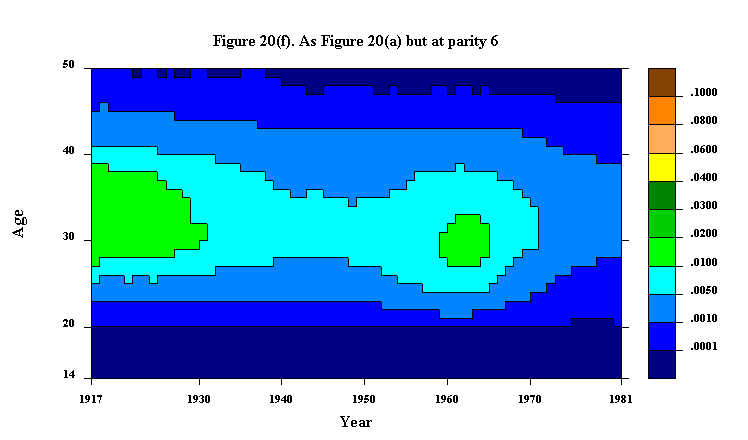
Figure 20. US parity-specific birth rates, from age 14 to 49 and year 1917 to 1980
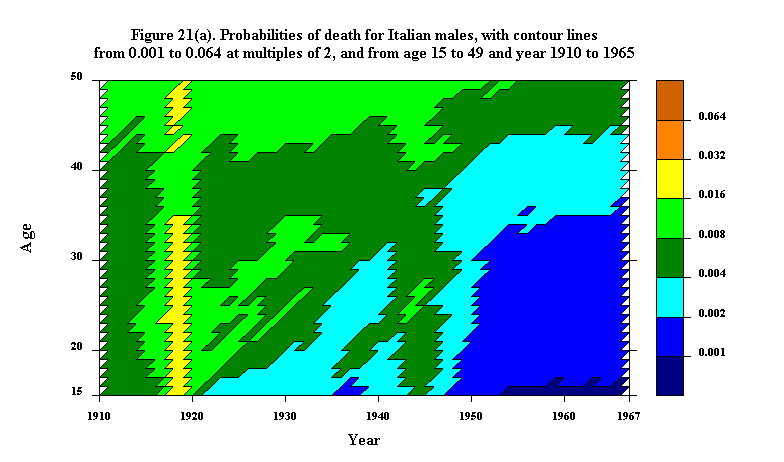
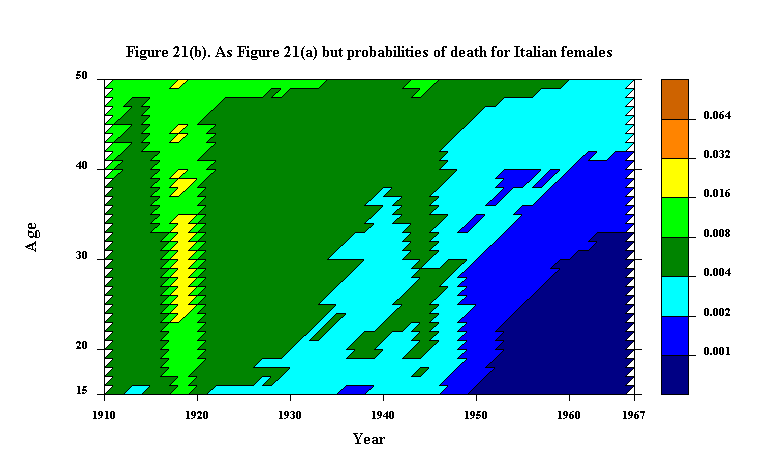
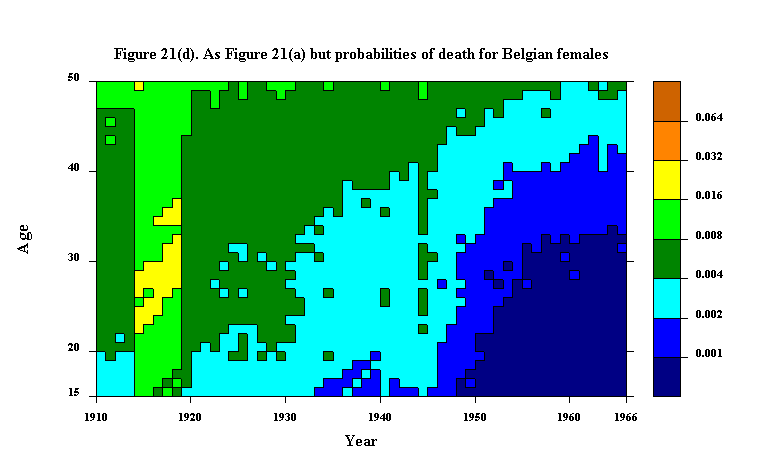
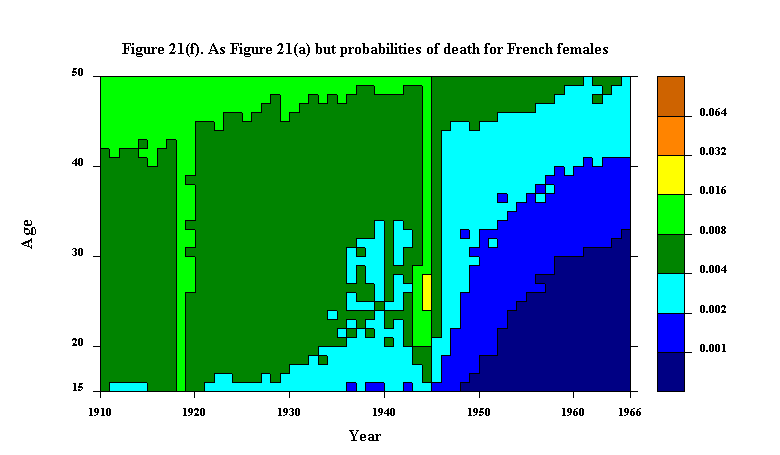
Figure 21. Probabilities of death for males and females in Italy, Belgium, and France, from age 15 to age 49 and year 1910 to 1965
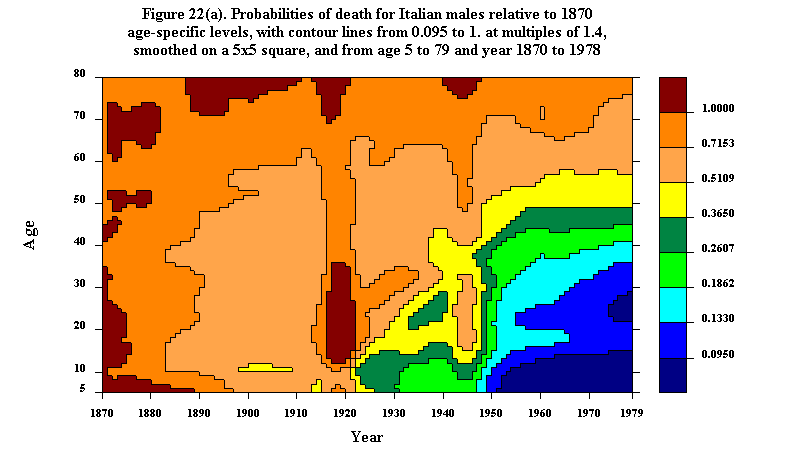
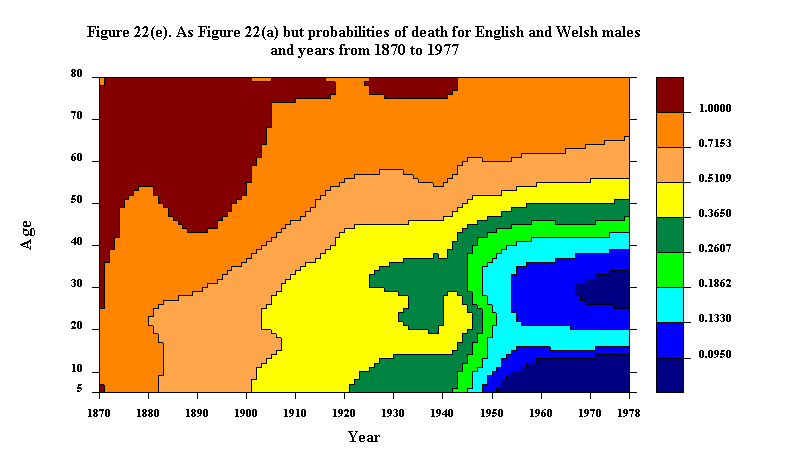
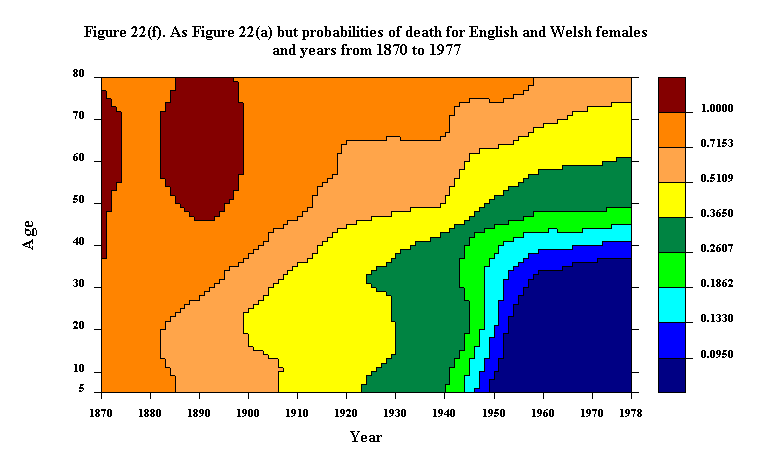
Figure 22. Probabilities of death relative to 1870 age-specific levels, for males and females in Italy, Sweden, and England and Wales, from age 5 to 79 and year 1870 to 1978
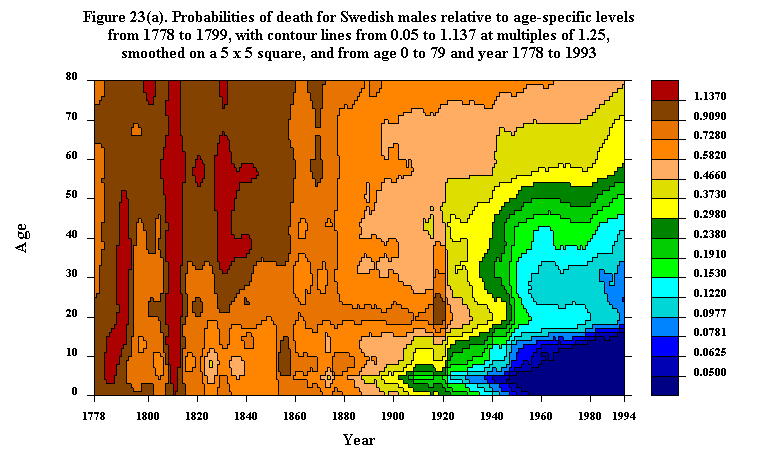
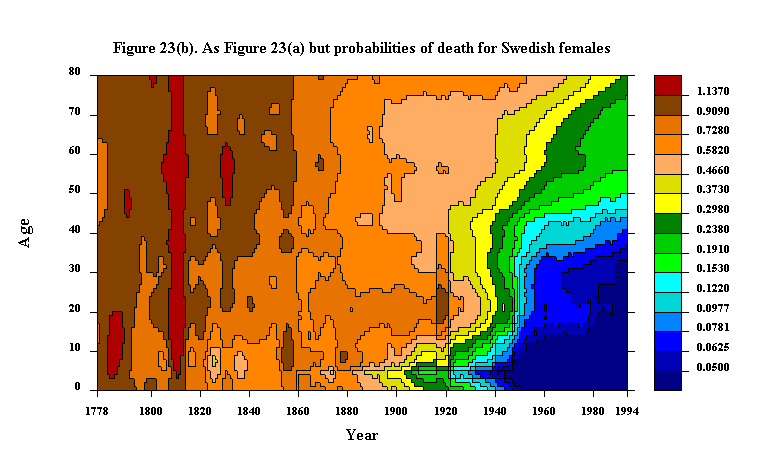
Figure 23. Probabilities of death in Sweden relative to age-specific levels from 1778 to 1799, from age 0 to 79 and year 1778 to 1993
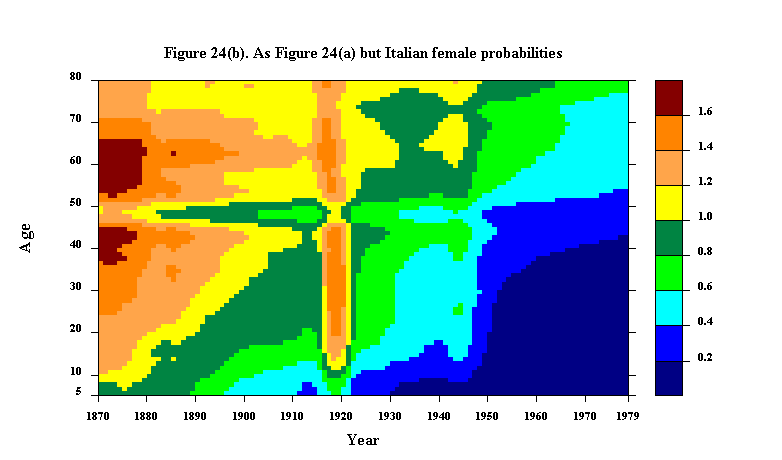
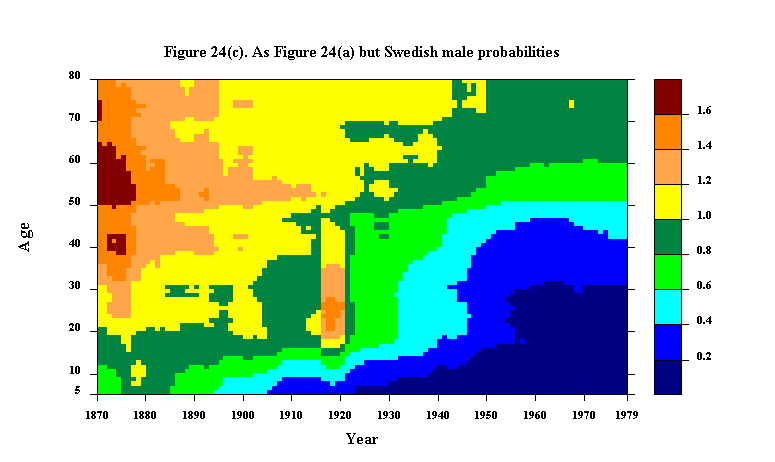
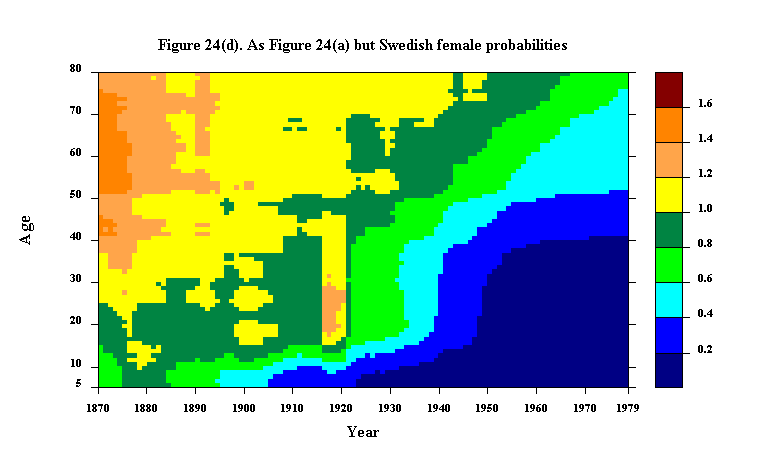
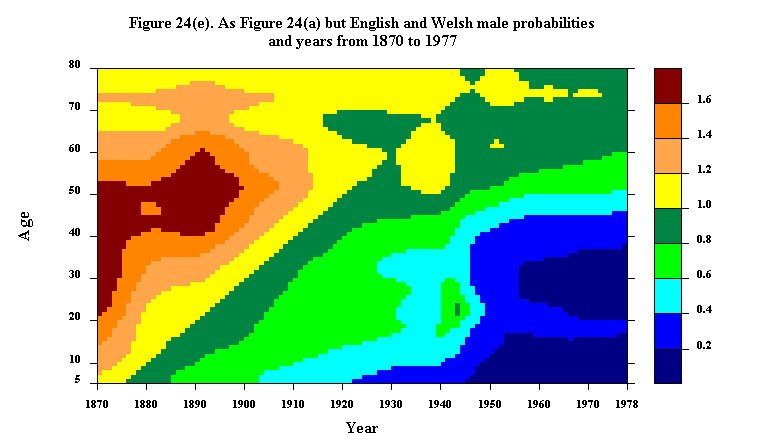
Figure 24. Probabilities of death relative to 1870 age-specific cohort levels, for males and females in Italy, Sweden, and England and Wales, from age 5 to 79 and year 1870 to 1978
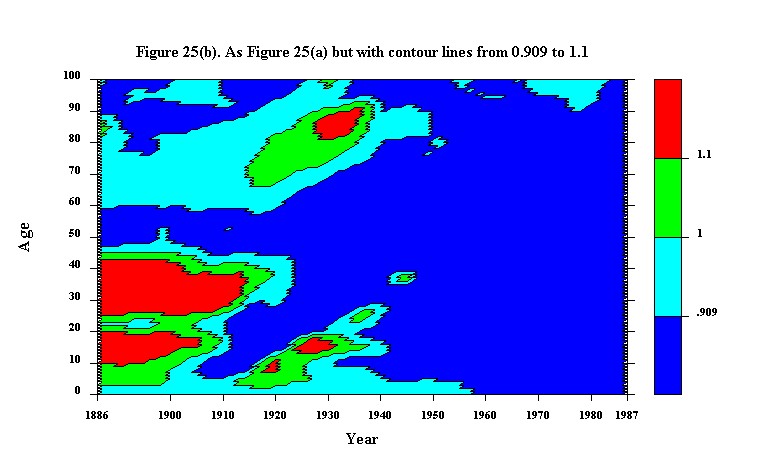
Figure 25. Probabilities of death for Italian females divided by Italian male probabilities, from age 0 to 99 and year 1886 to 1986
a. With contour lines at multiples of 1.1 from 0.513 to 1.21
b. With selected contour lines from 0.909 to 1.1
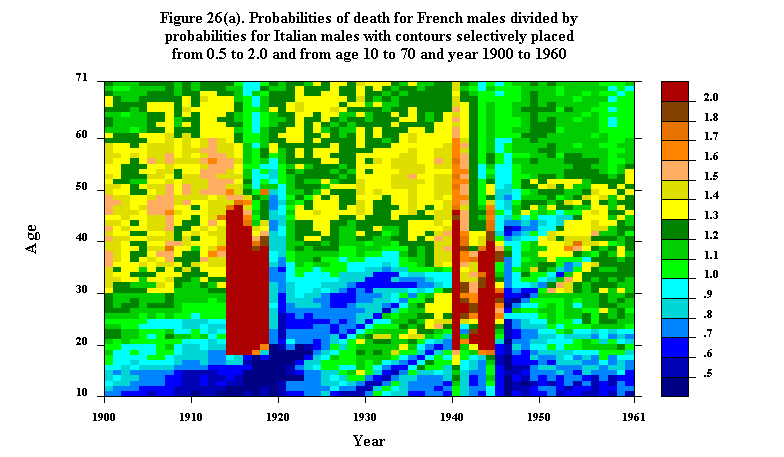
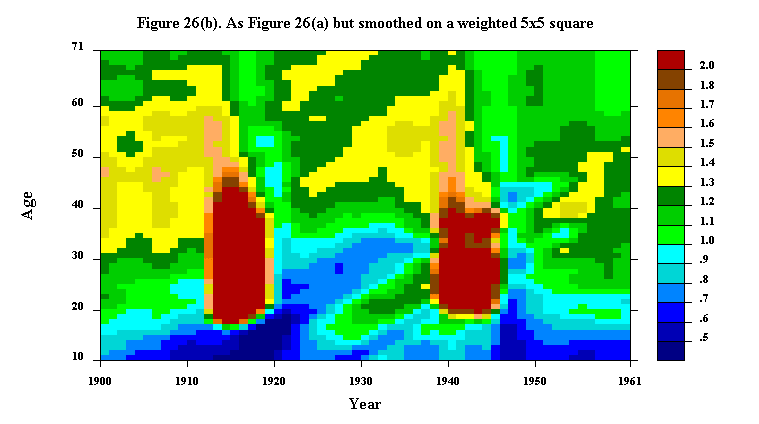
Figure 26. Probabilities of death for French males divided by probabilities for Italian males
a. From age 10 to 70 and year 1900 to 1960
b. As Figure 26(a), but smoothed on a weighted 5 x 5 square
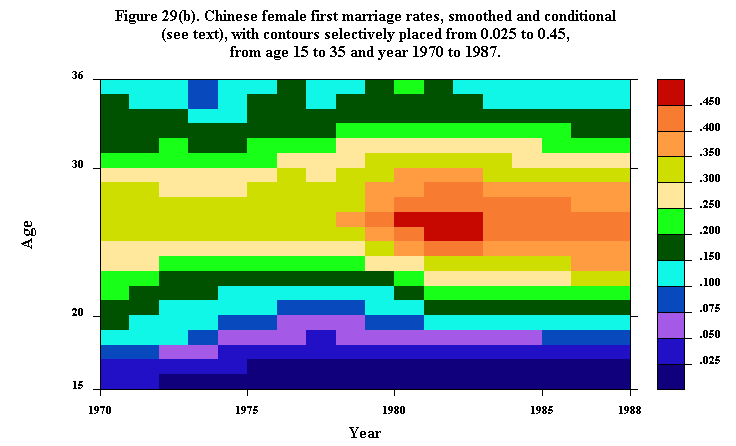
Figure 29. Chinese female first marriage rates, from age 15 to 35
b. Smoothed and conditional, from year 1970 to 1987
Figure 31. Belgian female population, from age 0 to 99 and year 1892 to 1977
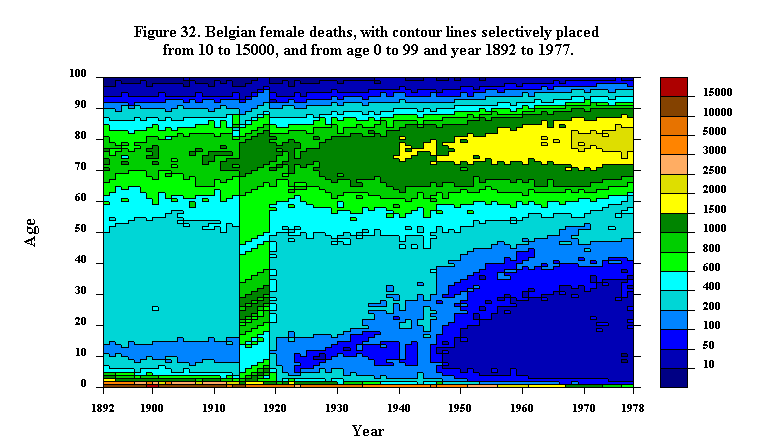
Figure 32. Belgian female deaths, from age 0 to 99 and year 1892 to 1977
Figure 33. Probabilities of death for Belgian females, from age 0 to 99 and year 1892 to 1977
Figure 34. Belgian female period survivorship, from age 0 to 99 and year 1892 to 1977
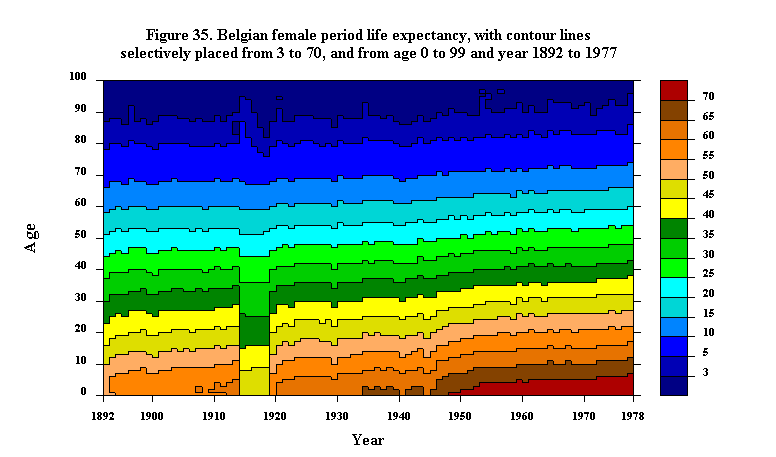
Figure 35. Belgian female period life expectancy, from age 0 to 99 and year 1892 to 1977
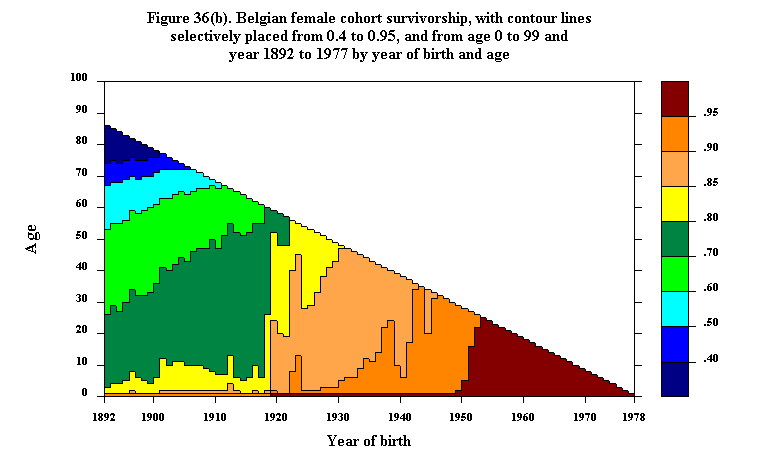
Figure 36. Belgian female cohort survivorship, from age 0 to 99 and year 1892 to 1977
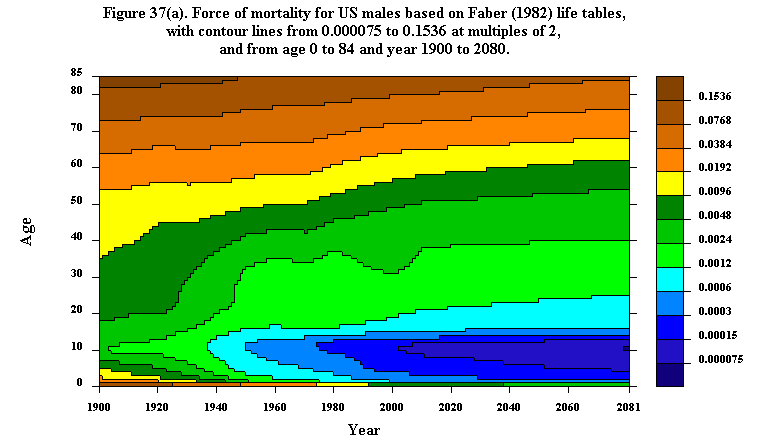
Figure 37. Force of mortality for US males and females based on Faber (1982) life tables, from age 0 to 84 and year 1900 to 2080 78
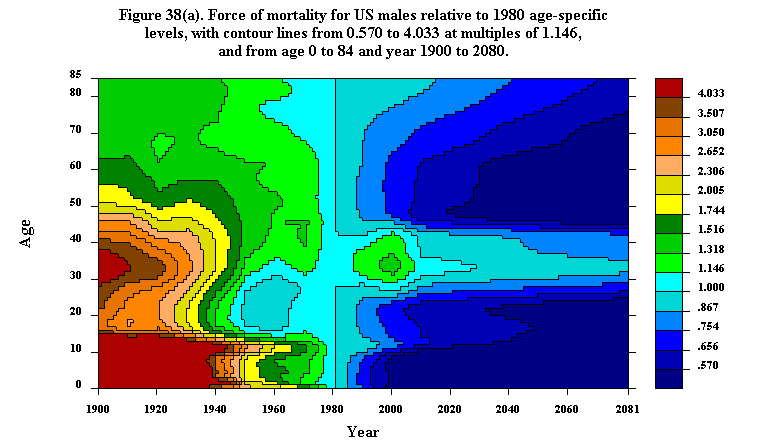
Figure 38. Force of mortality of US males and females relative to 1980 age-specific levels, from age 0 to 84 and year 1900 to 2080 79
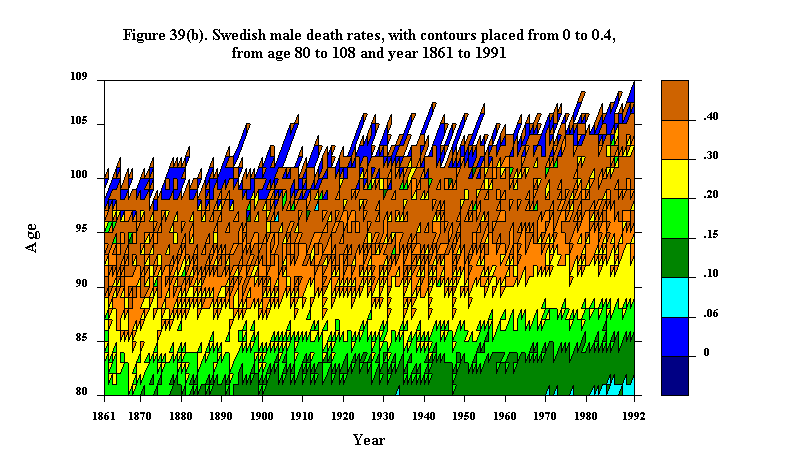
Figure 39. Force of mortality in Sweden, from year 1861 to 1991 81
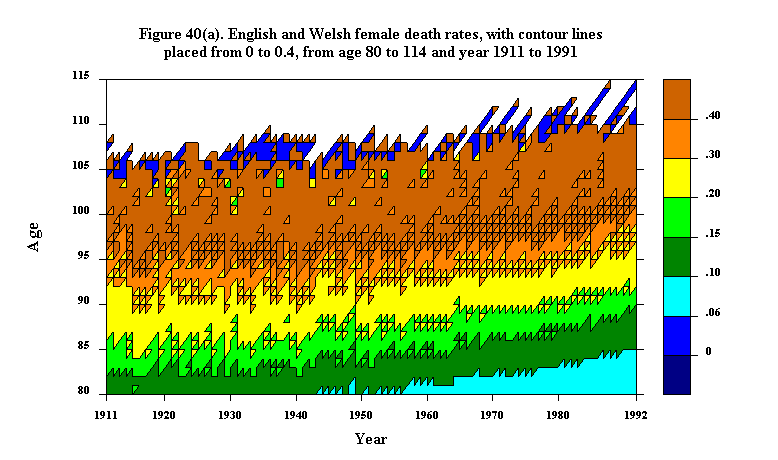
Figure 40. Force of mortality in England and Wales, from year 1911 to 1991 82
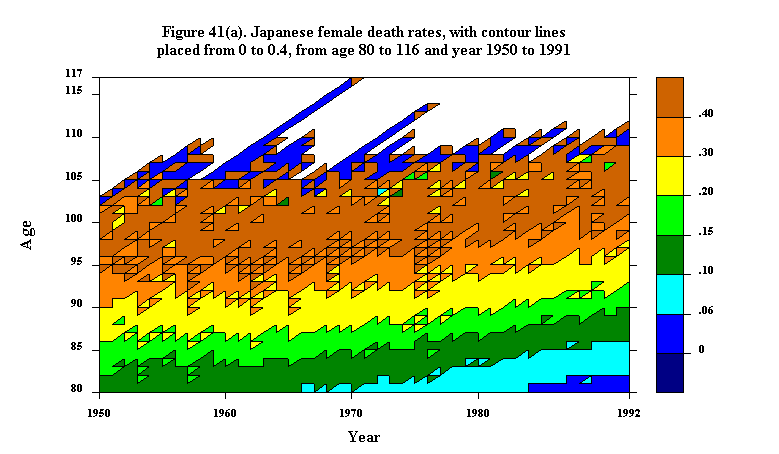
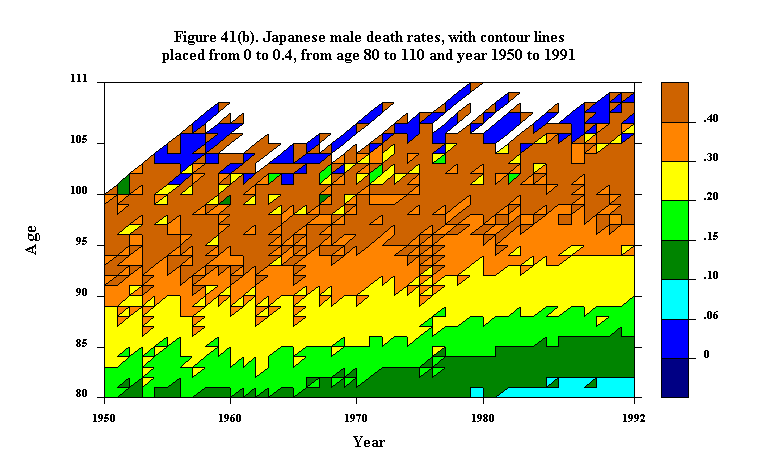
Figure 41. Force of mortality in Japan, from year 1950 to 1991 83
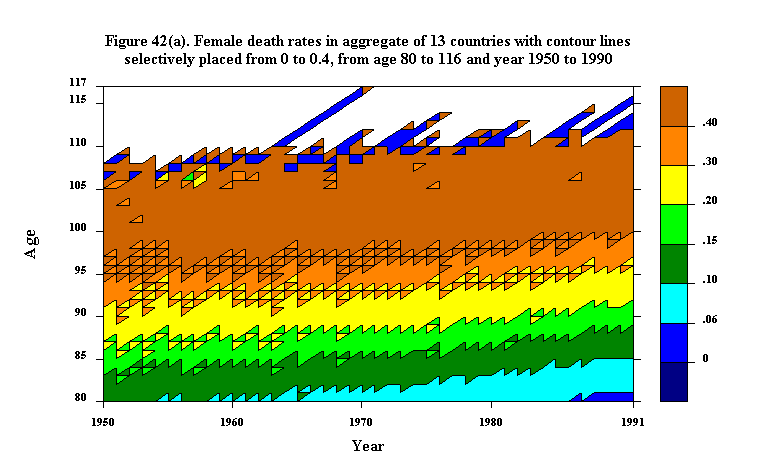
Figure 42. Force of mortality in aggregate of 13 countries, from year 1950 to 1990 84
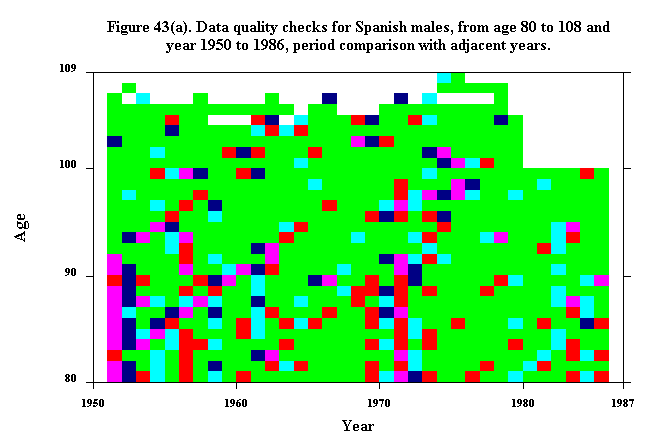
Figure 43. Data quality checks for Spanish males, from age 80 to 108 and year 1950 to 1986 86
a. Period comparison with adjacent years
b. Period comparison with adjacent ages
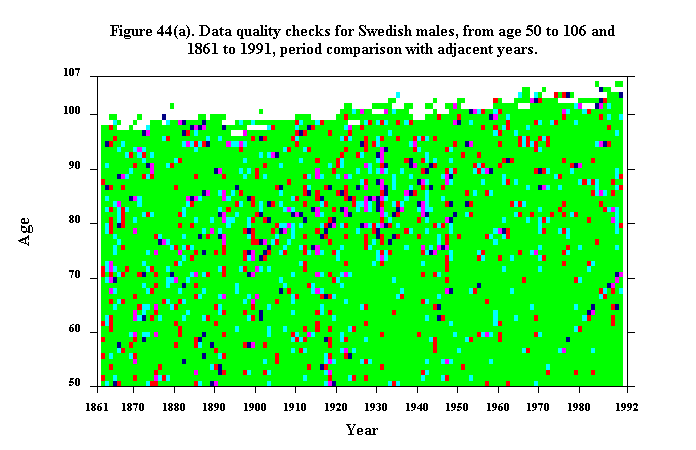
Figure 44. Data quality checks for Swedish males, from age 50 to 107 and year 1861 to 1991 88a. Period comparison with adjacent years
b. Period comparison with adjacent ages
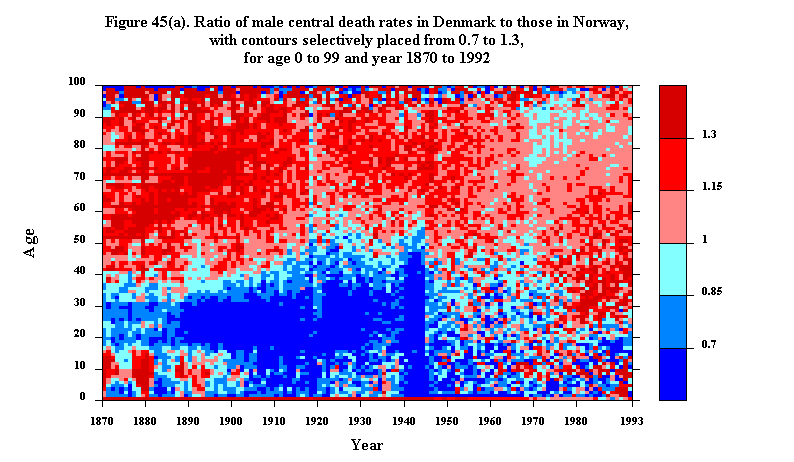
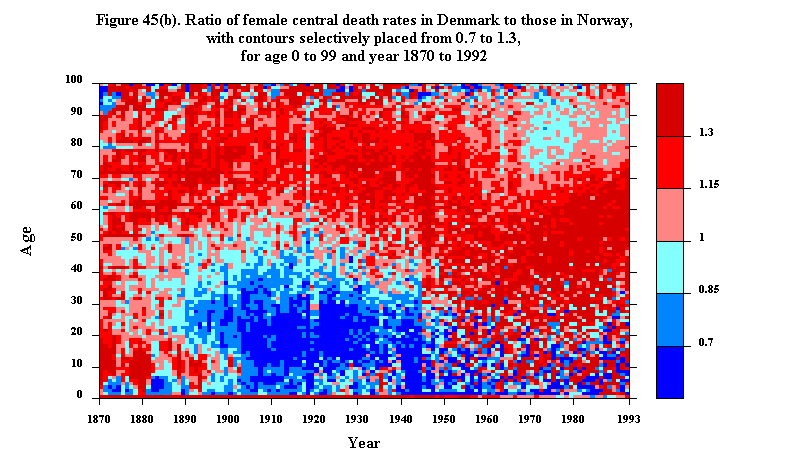
Figure 45. Ratio of central death rates in Denmark to those in Norway, from age 0 to 99 and year 1870 to 1992
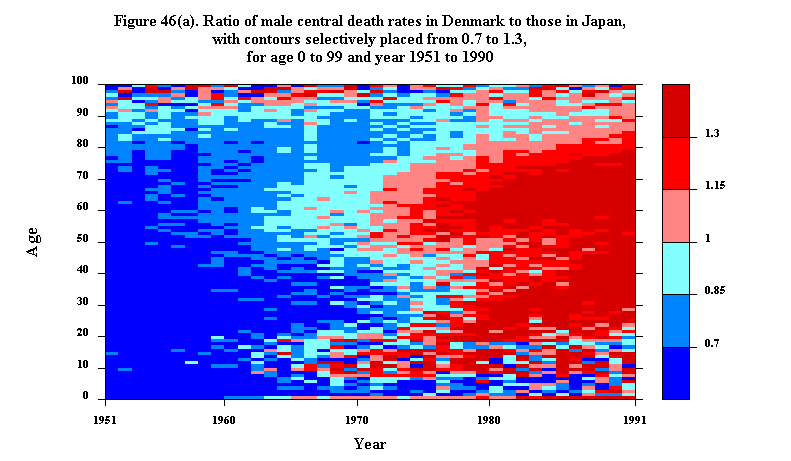
Figure 46. Ratio of central death rates in Denmark to those in Japan, from age 0 to 99 and year 1951 to 1990
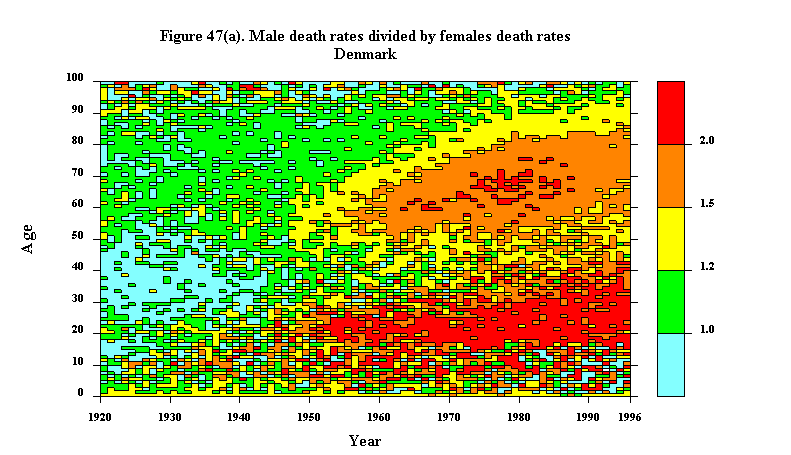
Figure 47. Sex ratio of mortality
Updated by L. Andreeva, 23-Sep-1998