
Validation of Exceptional Longevity
 |
Validation of Exceptional Longevity Validation of a Protocol for the Collection of Longitudinal Survival Data in Arles (France)by A. Cournil, J.-M. Robine, and M. Allard |
[ References ]
Most studies conducted on longevity are carried out on populations defined according to age criteria: the age of the person living at the moment of the collection or age at death. We can quote as examples the studies carried out on centenarians (Jeune and Vaupel 1994; Poulain 1998) or on a few cases of exceptional longevity, such as those on Jeanne Calment, who died at 122 (Allard et al. 1994), or on Christian Mortensen who died at 115 (Skytthe et al. in this volume). Apart from these studies of extreme - and even exceptional - cases, other more general studies deal with the distribution of ages at death in a population, through the drawing up of period life tables, or through the reconstruction of extinct cohorts according to the method proposed by Vincent in 1951 (Vincent 1951).
In these studies, the validation of the recorded or the claimed age is an important stage in checking the data quality. This stage is all the more important as the cases under study are exceptional. The validation of a person's age is generally carried out by cross-referencing various documents mentioning the concerned person (see in this volume: Desjardins; Robine and Allard; Thatcher). At a population level, the validation can be carried out by analysing the age distribution to detect possible irregularities. For example, Whipple's index makes it possible to measure the error due to age heaping (Wang et al. in this volume).
Our study has been conducted in a slightly different context, as we did not use reported age but life span as the basic information, by matching birth and death dates. Moreover, we did not choose a cross-sectional approach using period data but, reversely, a prospective longitudinal approach. The objective was to reconstruct the whole distribution of life spans of a birth cohort from the city of Arles, in France. At the end of the collection, we will have analysed a cohort born between 1875 and 1896. This cohort experienced the last cholera epidemics that occurred in south-eastern France, which brought about important variations in mortality - especially infant mortality - from year to year. A longitudinal approach will enable us to test, among other things, the influence of living conditions at young ages on longer-term survival. For example, can we put forward a selection effect that would result in greater resistance and therefore better survival of persons who experienced very harsh living conditions, especially during their first years of life. We should also recall that this collection was also initiated to test the influence of parental age at birth on children's longevity (Gavrilov 1997; Robine 1997).
The prospective longitudinal approach is rarely used for it requires high-quality public records, whose collection often takes much time. Moreover, with this kind of approach, researchers are often faced with problems of observation gaps and missing data. In the light of such constraints, the data collecting method used should be accurately defined. At the same time, one of the major scientific advantages of this approach is that it makes it possible to focus on the people who have been lost to follow-up, in quantitative and qualitative approaches. The aim of this article is to present and discuss the validation of a protocol for collecting longitudinal survival data.
Registrars have been in charge of recording births, marriages and deaths occurring in every "commune" (parish) since registry offices were established by the Decree of September 20th, 1792. Two subsequent laws made the reporting of other information in the margin of birth records mandatory: the law of August 17th, 1897 made marriage and divorce notes in the margin mandatory; the mention of the death became compulsory after the law of March 29th, 1945 was passed.
All records are kept in duplicate. A copy is kept in town halls for a hundred years and is then transferred to municipal archives. A second copy is kept in court record offices before being transferred to "departmental" archives. Any record older than a hundred years may be consulted by the public.
We collected most of the data we needed from the birth registers kept in the archives of Arles. When a birth is reported, the registrar draws up a birth record mentioning the names, first names and sex of the child, his/her precise birth date, as well as the date of the notification. It also specifies the names, first names, ages and professions of both parents when these are known. Subsequently, a death mention indicating the date and place may be registered in the margin of the birth record. This information is very interesting as it makes it possible to know the person's life span by directly matching the birth and the death dates, but it is not always available. As we have already mentioned, reporting the death in the margin was made mandatory in 1945. However in some "communes" (parishes), already before that date, it had become usual to mention the death in the margin of the birth record. This was the case in Arles, where a great number of marginal mentions had been recorded for a long time before 1945. The majority of the reports made before 1945 concerns the death of children in Arles. The marginal notes written down after the law was passed concern deaths which occurred in Arles as well as those which occurred in other communes. The mention in the margin is written down after a death certificate has been sent to the person's birth commune by the commune where the death occurred.
We have first conducted a systematic recording of a set of variables (presented in Table 1) from birth certificates. Recording is made for all birth certificates in an annual register. A birth register at this period in Arles represents about 600 births. Certificates from the years 1880 to 1896 have been collected.
During the second stage of the data collection, complementary research was carried out by investigating death registries. The objective was to match the birth records of people whose date of death is unknown, to the death records of Arles registers for the ten years following the birth. This stage enables us to find children's deaths which had not been reported in the margin of their birth records.
|
Table 1. Description of the variables recorded in the database. (*) Information recorded only when the date of death is unknown | ||||||||||||||||||||||||||||
| ||||||||||||||||||||||||||||
The purpose of this data collection was to describe the survival of the whole birth cohort, in other words to know the life spans of all the persons making it up.
At the end of the collection, we obtained 75 percent of complete life span data. This percentage raises the major problem of longitudinal studies, that of observation gaps. This response rate is the result of a compromise between data availability and time required for collecting data. However, the collection protocol chosen and the characteristics of the source availability, particularly regarding the marginal mention of deaths, enable us to reconstruct the whole distribution of life spans on the basis of three hypotheses.
Hypothesis 1: Deaths which occurred after 1945 are mentioned in the margin of the record, therefore they are known at the end of the collection.
Hypothesis 2: Deaths under the age of 10 are known. This implies, on the one hand, that the process of migration under the age of 10 is negligible, and on the other hand, that all deaths of children under 10 are recorded in the commune of Arles.
Hypothesis 3: This hypothesis is a corollary of the first two and postulates that all unknown deaths occurred after the age of 10 and before 1945.
From these three hypotheses, we can draw up an estimated life table and an estimated survival curve until the age of 10 and from 1945. Between both we will only keep the total number of deaths, without distributing them by age. Figure 1 shows these curves by sex and for two different years, 1886 and 1895, chosen as the limit dates of the period under study for which the collection has been completely achieved.
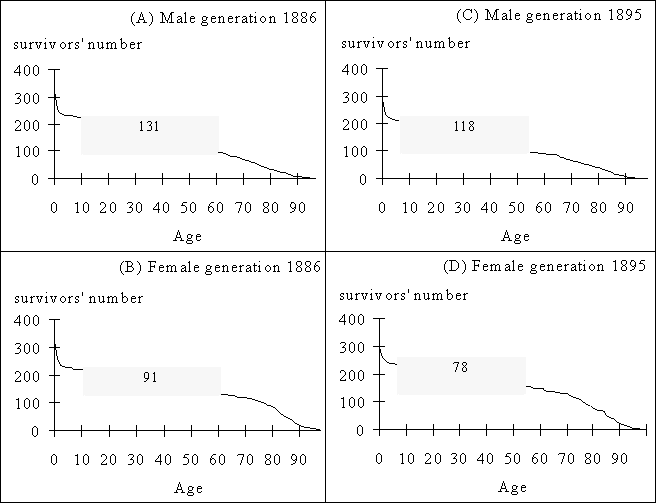 |
| Figure 1. Observed survival before the age of 10 and after 1945, when unrecorded deaths are supposed to occur between the two periods (grey rectangle). A: Male generation 1886. B: Female generation 1886. C: Male generation 1895. D: Female generation 1895. |
In order to check that deaths after 1945 are recorded, we propose to compare the empirical survival in Arles from age 60 to the survival of the same generation expected in all of France. The expected survival is calculated from French generation life tables, established by J. Vallin. These tables were published in 1973 (Vallin 1973) and were updated further on (Vallin, personal communication).
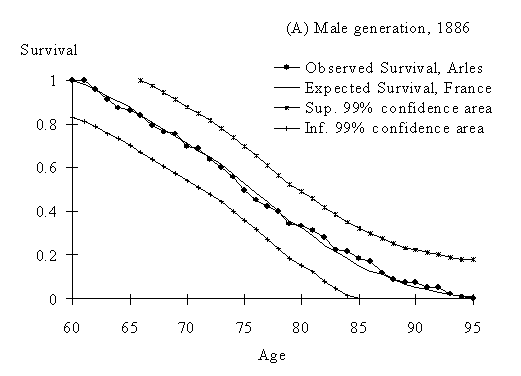
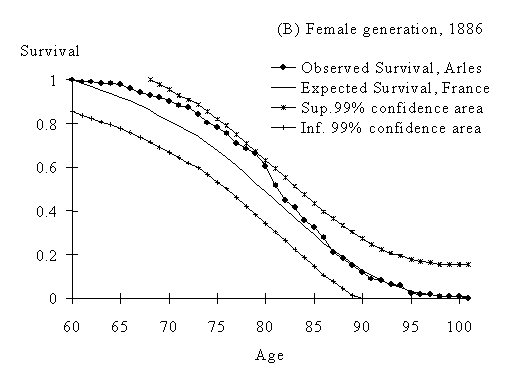
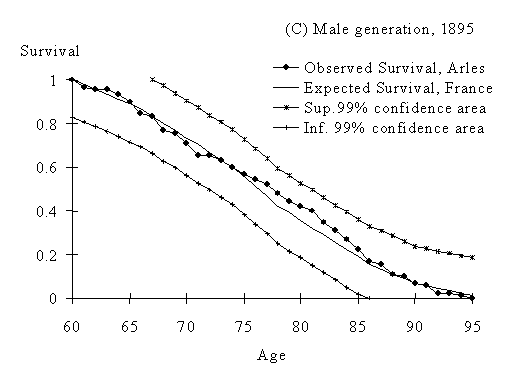
Comparisons are made up according to Kolmogorov's non parametric test (Sprent 1989). We could establish that in the four cases - men and women for each of the two generations - there was no significant difference between observed and expected survivals. The empirical survival curves are within the 99 percent confidence interval of the expected distribution (Figure 2).
 |
 |
 |
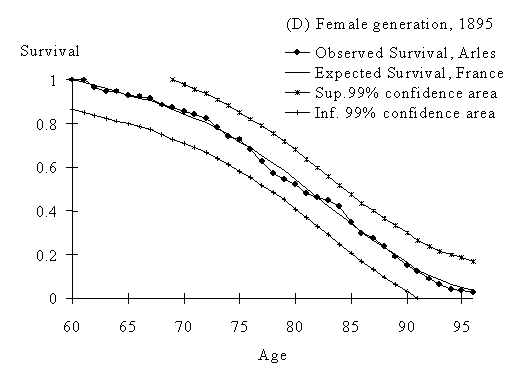 |
| Figure 2. Comparison of observed survival in Arles and expected survival in France for the same generation (Vallin 1973). Upper and lower limits of confidence interval are defined using the non-parametric Kolmogorov test (Sprent 1989). |
This result shows that deaths after 1945 are rather well reported as marginal mentions in the Arles birth registry. Therefore we can consider that the number of unreported deaths is negligible, or that these deaths are randomly distributed, without strongly deviating from the expected mortality. The age limit of 60 makes it possible to take into account deaths that occurred after 1945 for the two years considered, but it does not have the same value in both cases: the 1886 generation turned 60 in 1946, which is only a year after the law was passed, whereas the 1895 generation turned 60 in 1955, which is 10 years after the law was passed. Comparing these two generations may point to a possible problem of under-registration during the first years after the law was passed, which would result in a better adjustment for the 1895 generation. In fact, this seems to be the case, especially as regards women. For the 1886 generation, we notice a discrepancy between observed and expected survivals, with a lower death rate in Arles, which may be due to an under-registration of deaths at the beginning of the period. This discrepancy is not observed in the 1895 generation, nor is it in both male generations.
In order to check the hypothesis that all child deaths under the age of 10 are recorded in the database, we coupled the 1891 births to the nominal list of the 1901 census, when the children born in 1891 who were still alive turned 9 or 10.
The results of this complementary research are presented in Tables 2, 3 and 4. We first notice that out of 185 children who died before 1901, one was counted in 1901 (Table 2). This is probably due to an error in the marginal mention or to an error in the matching between birth and census, due for example to a homonymy. Whatever it may be, the error rate in this case is fairly acceptable.
Then, still considering the people whose death dates are recorded, we notice that 132 out of 287 people who died after 1901 are counted in the 1901 census, that is 46 percent (Table 2). The 155 uncounted people were alive when the 1901 census took place, therefore we may infer that they have left the commune of Arles. This is certainly true for some of them, which questions the hypothesis of non-migration under the age of 10. However, it seems very unlikely that 54 percent of the children migrated before the age of 10 during the nineteenth century. Therefore we may suppose that the migration problem adds to that of the quality of the nominal lists of the census. The matching of births with the 1901 nominal list brings some complementary information regarding unrecorded deaths. Table 2 tells us that 48 of the 125 unrecorded people were counted in 1901 census; it means that they died after 1901. Conversely, we do not know anything about the 77 people left. We may consider two different scenarios for unrecorded deaths and show that the real situation is in-between these two cases, by assuming that the differences in the census rate in Arles between the groups whose date of death is recorded and those whose date of death is not recorded, are only due to differential mortality. This assumption relies upon the fact that recorded deaths after 1901 concern mainly deaths that occurred after 1945. In that case, the death recording should not be strongly affected by migration, thanks to marginal report process.
|
Table 2. Number and proportion of people counted in the 1901-census in Arles according to recording of date of death and death period | |||||||||||||||||||||||||||
| |||||||||||||||||||||||||||
|
Table 3. Number and proportion of men counted in the 1901-census in Arles according to recording of date of death and death period | |||||||||||||||||||||||||||
| |||||||||||||||||||||||||||
|
Table 4. Number and proportion of women counted in the 1901-census in Arles according to recording of date of death and death period | |||||||||||||||||||||||||||
| |||||||||||||||||||||||||||
The first scenario postulates that all unrecorded deaths occurred after 1901, that is over the age of 10. In this case, we may compare the proportion of people counted among the group with recorded deaths occurring after 1901 and the group with unrecorded deaths. If this hypothesis is true, the proportion of people counted would be the same in both groups. We can notice in Tables 3 and 4 that this is not the case, neither among men nor among women. In fact, the proportion of people counted among unrecorded deaths is always smaller than that of people who died after 1901 and whose death dates are recorded, which probably means that a proportion of people whose death dates are unknown died before 1901 and therefore could not have been counted. The hypothesis that all unrecorded deaths occurred after 1901 appears not to be verified.
The other scenario consists in assuming that the distribution of unrecorded deaths is the same as that of recorded deaths. In the same way, we can compare the census proportion in the two groups. We have to calculate the census rate of all recorded deaths - before and after 1901 - and compare this rate to the census rate of unrecorded deaths (Cf. Tables 5 and 6). The census rate of the unrecorded deaths is always higher than that of the other group, the discrepancy being more marked in women. This suggests that the group with unrecorded deaths has a mortality before 10 lower than the group with recorded death.
|
Table 5. Number and proportion of men counted in the 1901-census in Arles according to recording of date of death | ||||||||||||||||||||
| ||||||||||||||||||||
|
Table 6. Number and proportion of women counted in the 1901-census in Arles according to recording of date of death | ||||||||||||||||||||
| ||||||||||||||||||||
Therefore it seems that the real mortality pattern of unrecorded deaths is in-between the two scenarios. The first scenario in which we consider that all deaths whose dates are known occur after 1901 will provide a minimum estimation of the mortality of children under the age of 10, whereas the other scenario will provide a maximum estimation by distributing the unrecorded deaths proportionally to those whose dates are known.
The third hypothesis postulates that all unrecorded deaths occur between the age of 10 and the year 1945. We can first compare the number of deaths between the age of 10 and the year 1945 obtained according to this hypothesis with the expected number of deaths according to Vallin's curves for the two reference years, that is 1886 and 1895. We notice that in Table 7 the estimated sample sizes are significantly different in one case only, that of 1895-generation of women. These results suggest that hypothesis 3 is fairly reliable.
|
Table 7. Number of deaths between the age of 10 and the year 1945 estimated according to the third hypothesis and expected according to Vallin's mortality curves. The two distributions are compared using a x2 test. NS: non significant test (p>0.05); S: significant test (p<0.05) | |||||||||||||||||||||||||||||||||||||||||||||||||||||
| |||||||||||||||||||||||||||||||||||||||||||||||||||||
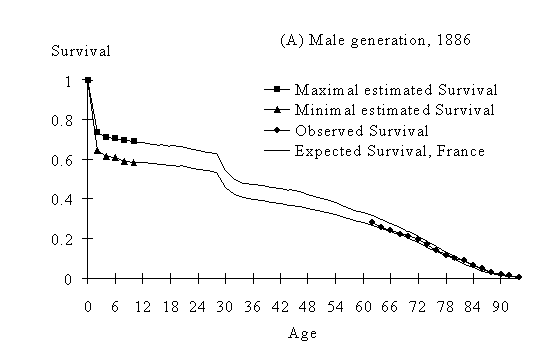
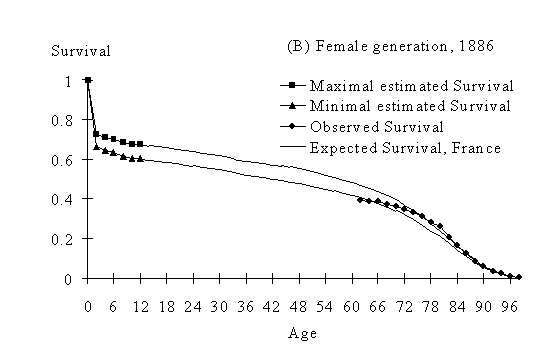
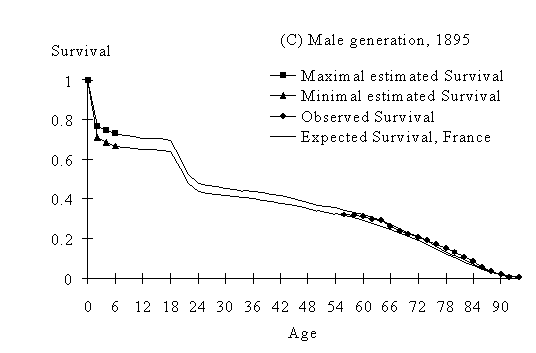
We can slightly correct our estimations by taking the results of the validation of the first two hypotheses into account. We can calculate the survival before the age of 10 in both scenarios. We can then compare the observed survival from 1945 with the expected survival for France, based on the number of survivors at age 10 for each of the two, minimum and maximum estimations. The survival curves constructed for the 1886 and 1895 generations are presented in Figure 3.
 |
 |
 |
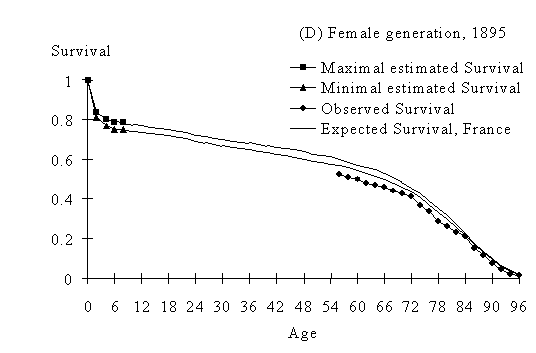 |
| Figure 3. Observed survival in Arles from 1945 and expected survival in France calculated using maximum and minimum estimations of the number of survivors at the age of 10 in Arles. |
The comparison of the two generations shows that the lower the mortality observed before the age of 10 is, the shorter the gap between the expected curves. As regards men, we can notice that the survival obtained after 1945 is approximately in-between the two expected curves, calculated from the age of 10. This result is coherent with the previous results. In contrast, in women, the observed survival from 1945 is slightly lower than the expected curves, but the gaps between the curves remain rather small.
Throughout this study, we could observe that the difference in the results between men and women was almost constant. Does this difference reflect the differential mortality between the sexes or does it reveal a difference in the quality of registration? We can first underline that the number of unrecorded deaths is always higher for men than for women. This is mainly due to the fact that mortality between the age of 10 and the year 1945 in the considered generations is higher for men, therefore the number of unrecorded deaths is higher.
As regards the census, we notice that the proportion of people counted in the census and having a recorded date of death is slightly higher for men, however the difference is not significant. This trend is reversed in the group of unknown dates of death, but in this case the gap between the census rates might be due to differential mortality. In fact, it seems that among the group of unrecorded deaths, the number of living girls likely to be counted through the census, is slightly higher than the number of boys, which would explain why the census rate is higher.
Finally, on Figures 2 and 3, we notice that, as regards men, the curves observed are always better adjusted to Vallin's curves. We can propose at least two reasons for this difference. On the one hand, it may be related to a difference in the quality of the report of marginal mentions. The fact that women change their names when they marry may have increased the difficulty in reporting deaths in the margin, which consists in matching a deceased person's identity with a birth record. The second explanation refers to the differential impact of WWI between sexes. The mortality in men, at the level of whole France, may significantly differ from that observed in Arles, during WWI. If we suppose that the impact of WWI is less marked in Arles, there is still a symmetrical pattern, as the mortality observed in men, in Arles, is slightly lower than the expected mortality in women.
We can conclude that our collection protocol seems to be appropriate as it enables us to reach our objective, that is to draw up a reliable estimation of the generations' survival.
Some precautions may be taken to improve the quality of the data. On the one hand, when studying mortality in adults, it is better to consider an age class at death which does not take into account the first two or three years after 1945, for these may present a slight under-registration. On the other hand, the use of mortality indicators under the age of 10 may be approached according to a particular method of analysis which consists in taking into account the two minimum and maximum estimations of mortality under the age of 10 successively. If the results remain unchanged in both cases, we can assert that they are reliable. It is necessary to do so when dealing with the most remote cohorts, born when infant mortality was high. It is less necessary with recent cohorts as the gap between both estimations is smaller.
In this study, we focused on the major difficulty in longitudinal approaches, that is observation gaps and missing data. In some cases, it is possible simply not to consider them if we are certain that this will not bias our study sample. However, in many cases, paradoxically it is better to take these missing data into account. Specific methods for the statistical processing of missing data or censored data - in the case of survival - have already been developed. We can set as an example Kaplan-Meier's survival estimator, or Cox's model (Kalbfleisch and Prentice 1980). Some data set raise specific problems which cannot be solved through classical methods. In this case, it is necessary to develop a specific approach to overcome the difficulties, which is what we attempted to do in this study. A cross-sectional approach does not present such difficulties, as it considers a sample whose dates of death are known a priori. However, the major problems it raises are those regarding the sample's completeness and representativeness, which are sometimes very difficult to solve. Anyway, longitudinal and cross-sectional approaches are very complementary and, considering the complex topic of longevity, it is always interesting to try to develop original approaches, which is made possible by the database on longitudinal survival data in Arles.
The authors are grateful to Caroline Boyer for collecting data, to Jacques Vallin for providing updated French generation life tables, to Jacques Magaud for very helpful comments and discussions and to Marie Rivet for assistance with the English translation.
[ Home | Contents | Return to previous page ]
Max-Planck-Gesellschaft 2003