16. Oldest-old mortality
As shown earlier in Figures 12 and 13, the numbers of octogenarians, nonagenarians, and centenarians has exploded in recent decades. Close to half of female deaths and a third of male deaths in developed countries now occur among those above age 80. To help meet the need for more extensive, more reliable data on mortality and survival at advanced ages, the Odense Archive of Population Data on Aging was established in 1992 at Odense University Medical School.
An important part of the archive is the Kannisto-Thatcher Oldest-Old Database. Väinö Kannisto, Distinguished Research Fellow at Odense University Medical School and former United Nations advisor on demographic and social statistics, assembled the core set of data, tested the data for quality, and converted the data into cohort mortality histories. These data, which pertain to death counts and population counts by year of age, year of birth, and current year over the last four decades or so in some thirty countries, permit estimation of death rates after age 80. Also included in the database are comparable materials on England and Wales made available by A. Thatcher, formerDirector of the Office of Population Censuses and Surveys and Registrar-General of England and Wales. Kannisto and Thatcher used the same extinct-cohort method to estimate population counts from death counts.
In addition, the Odense Archive includes an exceptionally reliable database of death counts and population counts for Sweden, from 1861 until the present, starting at age 50. This database was created by Hans Lundström, a demographer at Statistics Sweden. Data from the Odense Archive have been analyzed in four other monographs in this series and will undoubtedly be used in future monographs as well. The four monographs are by Kannisto (1996), Jeune and Vaupel (1995), Kannisto (1995), and Thatcher et al. (forthcoming). The next figures in this monograph, Figures 39 through 44, are based on data from the Odense Archive--from Lundström's database for Sweden and from the Kannisto-Thatcher Oldest-Old database for other countries.
Figure 39 displays the evolution of mortality after age 80 since 1861 for females and males in Sweden. Because the underlying data are broken down by both year of birth and current year, the surfaces consists of small triangles. The mortality levels are estimates of the force of mortality: they are very nearly equal to death rates calculated by dividing the number of deaths in a triangle by the person-years lived in the triangle.
The grey diagonals at the top of the figures represent the lingering survival of the last member of a cohort: the red triangle at the end of the diagonal marks the death of the exceptional longliver. Since 1861 longevity records have been repeatedly broken. In the 1860s and 1870s an occasional female survived to 105 and an occasional male to 101. In the 1980s a woman died at age 111 and in 1991 a man was still alive at 108. The contour lines tend to move upward to more advanced ages over time: this reflects improvements in mortality. For 80-year-old females in the 1860s, the force of mortality was about 0.15. In the 1980s it had fallen to under 0.06 and it was not until age 89 that the force of mortality reached 0.15. Most of this progress was achieved since the 1930s. For males the improvements in mortality are less dramatic but still apparent.
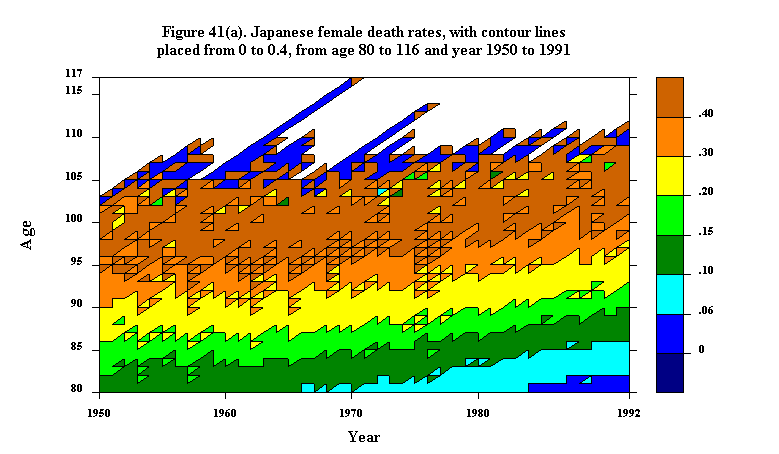
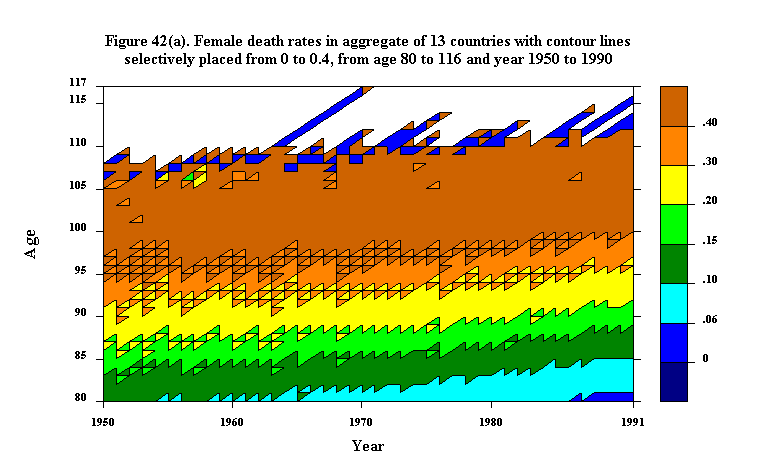
Figures 40, 41 and 42 presents similar data on the same mortality-rate scale but in black and white. The data for England and Wales in Fig. 40 start in 1911. The data for Japan in Fig. 41 start in 1950. Finally, data for an aggregate of 13 countries from 1950 through 1990 are presented in Fig. 42. The 13 countries are Austria, Denmark, England and Wales, Finland, France, Germany (West), Iceland, Italy, Japan, the Netherlands, Norway, Sweden, and Switzerland. As explained in Kannisto (1994), these countries have particularly reliable data that is available for all or most of the period 1950-1990.
For females the death rate reaches 0.15 at age 82 or 83 at the start of all three maps and reaches age 89 or 90 in 1990 or 1991. Indeed, comparison of the various mortality levels shows that by 1990 Sweden, England and Wales, Japan, and the aggregate of 13 countries had roughly similar trajectories of mortality after age 80, both for females and for males. More detailed comparisons of similarities and differences are provided by Kannisto (1996).
As discussed in Jeune and Vaupel (1995), many reputed centenarians are actually much younger and genuine supercentenarians (age 110 and above) may only have emerged in recent decades. Kannisto, Thatcher, and Lundström endeavored to check questionable longlivers, especially supercentenarians, and to remove cases that seemed doubtful. The Swedish database created by Lundström is exceptionally reliable, but even it may contain an error here and there at some ages and years. Data for other countries certainly include some errors that may be relatively large at the most advanced ages when hardly anyone is alive. Kannisto and Thatcher usually erred on the side of caution and removed people who may actually have attained an advanced age; more rarely they may have inadvertently accepted a dubious case. In particular, the Japanese woman who died at age 116 in 1970, as shown on both Fig. 41a and 42a, seems questionable. The second longest-lived member of her birth cohort died at age 104 and in both previous and subsequent birth cohorts record longevity was several years less, not only for Japan but for the aggregate of 13 countries as well.
Updated by L. Andreeva, 23-Sep-1998