October 22, 2012 | News | New Publication
Age 100 Is within Sight
In 1950, the average life expectancy for women in Iceland was 73.5 years—the highest level in the world in that year. But this figure is a snapshot of the conditions of the year 1950 projected into the future. The global life expectancy record for women of this cohort is actually expected to be at least 10 years higher.
(The following text is based on the original article "Steep increase in best-practice cohort life expectancy. Population and Development Review 37(2011)3: 419-434" by MPIDR researcher Vladimir M. Shkolnikov and has also been published in the issue 03/2012 of the demographic quarterly Demografische Forschung aus Erster Hand.)
In a study, Vladimir Shkolnikov and his colleagues from the Max Planck Institute for Demographic Research have predicted that the life expectancy record among national populations for women born in 1950 will be almost 84 years, and it won’t be set in Iceland, but in Switzerland. The reason for the large difference in these numbers is the steady rise in life expectancy. Mortality has declined due to continuous improvements in living conditions and medical care. This means that a woman born in 1950 has benefited from these improved conditions with each year of her life. But this development cannot be captured by conventional calculation methods, as they only take into account the age distribution of the population and of deaths in a given calendar year. Demographers refer to the result of these calculations as the “period life expectancy.”
The period life expectancy shows how long these women would live if mortality rates in Iceland in 1950 did not change in subsequent years. In reality, however, mortality rates decline over time. Whereas the period life expectancy in Switzerland in 1950 was 71 years, and was therefore lower than the comparable figure for Iceland, today the Swiss 1950 birth cohort are projected to reach an average age of almost 84 years. This means that women in Switzerland face a lower mortality risk than women in Iceland. Thus, for the year 1950, Iceland is the so-called “best-practice” country with the highest (period) life expectancy for women. But Switzerland holds this title for the country with the highest cohort life expectancy for the 1950 birth cohort.
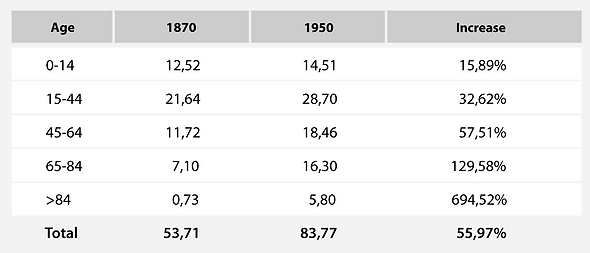
Tab. 1: Life expectancy grew by 30 years for the birth cohorts born between 1870 and 1950. Most of this increase is attributable to the fact that mortality for the age groups 65-84 and 85+ declined significantly. The contribution of these age groups to total life expectancy increased sharply from 1870 to 1950. © HMD, authors’ own calculations
In contrast to the period life expectancy for the year 1950, which was calculated using the actual deaths in that year, the cohort life expectancy figures for 1950 can be only partially calculated. This is because, in 2008, when the study was conducted, demographers only knew how many women in this cohort had died up to age 58.
Researchers had to forecast the development of mortality rates over the following years. To do this, they modeled the mortality for each age group and year using the Lee-Carter model. This was necessary for the cohorts born in 1921 to 1950. However, no Lee-Carter projection was needed for the older cohorts studied, who were born in 1870 to 1920, as the death rates for these cohorts were known to a very high age (a minimum 88 years).
However, for both the final as well as the projected figures, researchers found that the gap between the record life expectancy of a single calendar year (period) and of the birth cohort of the same year was growing progressively larger (see Fig. 1). In the years 1870 to 1920, the highest observed period life expectancy rose by around three months per year. But in reality, women in the so-called best-practice countries gained more five months each year relative to female cohorts who were one year older, while benefiting from a steadily rising life expectancy over the course of their lives (see Fig. 1). Thus, in the period from 1870 to 1920, the gap increased from 1.3 years to almost nine years. The actual lifespan attained by women born in 1920 in the best-practice countries was therefore nine years longer than the mortality rates for the year 1920 indicated. If this development continues, Vladimir Shkolnikov and his colleagues predict that cohorts born in the 1970s could have a cohort life expectancy of 93 years in the best-practice countries. The corresponding period life expectancy for cohorts born between 1970 and 1979 is only 77 to 80 years.
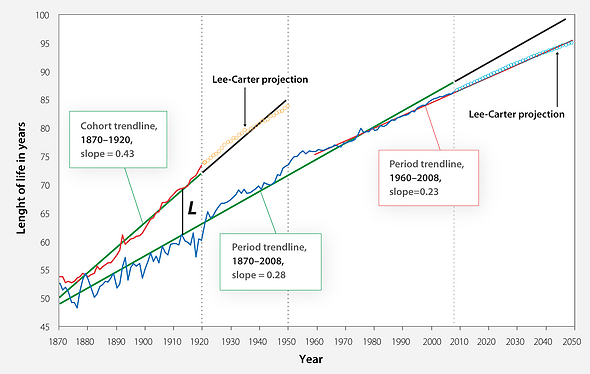
Fig. 1: Record period life expectancy, calculated using the mortality rates of each calendar year, has been rising at a relatively steady pace since 1870 (blue line). Record cohort life expectancy among cohorts born from 1870 to 1920 has increased as well, but more steeply (red line). The dashed lines represent predicted values. © HMD, authors’ own calculations.
These differences in lifespan have significant implications for the pension, insurance, long-term care, and health care systems. Large gaps could soon appear in pension calculations if this rise in life expectancy is not adequately taken into account. This issue is especially important because additional years of life are being gained primarily at higher ages. When life expectancy rises, different age groups make varying contributions to this increase. Whereas a century ago improved survival rates among infants, children, and adolescents contributed the most, today declining mortality rates among people who have already reached retirement age or even older are largely responsible for the increases in life expectancy.
It is also interesting to note how many years of life are now lived after age 65. Women who were born in the record cohort of 1870 (in Norway) had another 15 years to live at age 65, whereas women born 80 years later, in the record cohort of 1950 (in Iceland) can, on average, expect to reach nearly 90 years of age. This means that cohort life expectancy rose 10 years on average. Over the same period of 1870 to 1950, the remaining period life expectancy of 65-year-olds rose by only around three years (see Tab. 2).
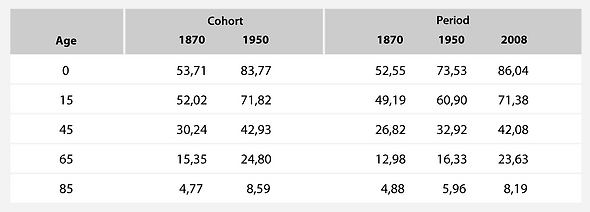
Tab. 2: The remaining life expectancy for newborns, 15-, 45-, 65-, and 85-year-olds can be calculated by calendar year (period) and by birth cohort. While the difference between the cohort and the period life expectancy was relatively small in 1870, it had grown to eight years by 1950. © HMD, authors’ own calculations
Vladimir Shkolnikov and his colleagues emphasized that further increases in life expectancy can be expected in the future. It is frequently said that factors such as excess weight and cigarette smoking could put an end to this positive trend in life expectancy. Shkolnikov noted, however, that factors such as these have in the past only slowed down the increase in life expectancy.
One question remains: In which countries will people live the longest? Since 1870, the Scandinavian countries in particular have been setting new standards in period life expectancy for women. These countries were not overtaken by Japan until the mid-1980s. The picture for the highest cohort life expectancy looks somewhat different. Again, Norway has set a number of records in cohort life expectancy, especially for cohorts born between 1870 and 1919. But for women born between 1920 and 1950, projections indicate that Switzerland, Australia, and New Zealand are ahead. All of these countries demonstrate how much scope other countries have to increase the average lifespan of their people.