December 08, 2021 | News | Interview
How to Measure Lifespan Inequality in Mortality with a New Metric

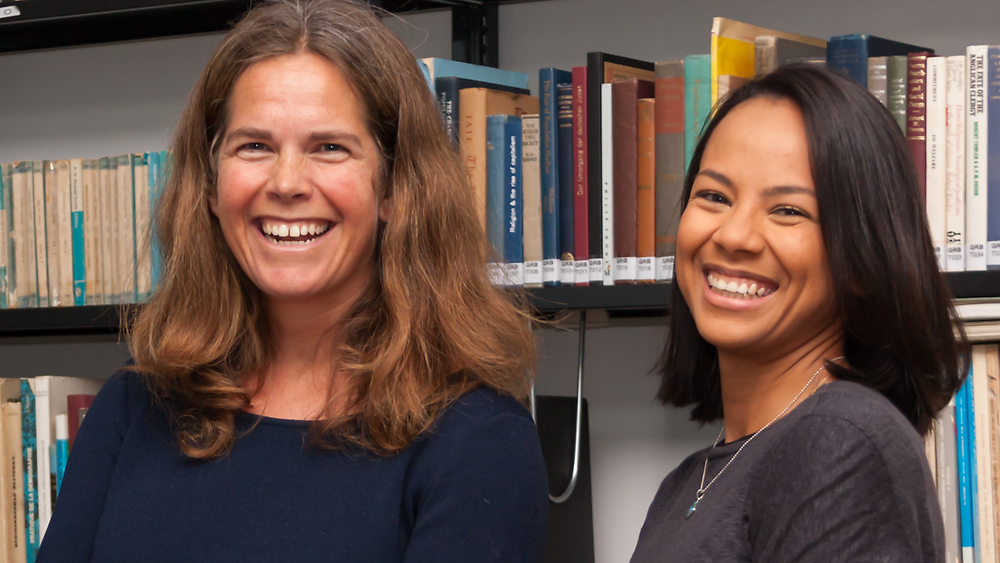
Alyson van Raalte and Marília Nepomuceno © MPIDR
MPIDR-Researchers Marília Nepomuceno and Alyson van Raalte propose a novel lifespan variation measure in their recent paper published in “Demography”. In this interview, the researchers explain why it is important to analyze lifespan inequality and how the new metric provides an alternative perspective.
Dr. Nepomuceno, Dr. van Raalte, you introduced a new mortality metric in lifespan variation. What is it about?
Dr. Nepomuceno: When people are asked how certain they are to live to a given age, they might have an eye on current death rates, and they might project trends forward. But more likely they take a guess based on how different the ages at death were of those who they were close to: parents, friends, neighbors, current and former colleagues. Some of these people might have died recently, others perhaps a generation ago.
Dr. Van Raalte: Our new mortality metric, which we call cross-sectional average inequality in lifespan, or CAL†, is more closely aligned with this timing perspective. Basically, we calculate the variation in ages at death an average person in the population would have been exposed to over their entire lifetime.
How does that approach differ from mortality metrics in general?
A.v.R.: Most of the time, we compare populations based on average levels of mortality given current mortality rates. The best example is period life expectancy at birth, usually just called life expectancy. To calculate that life expectancy, we ask the hypothetical question: What would be the average age at death in the population if everyone lived their entire lives, that is, from infancy through old age, exposed to the age-specific death rates in a given year? Of course, no one lives their entire lives within one calendar year! But this is a useful measure to make comparisons across populations.
M.N.: Exactly, but life expectancy is just an average metric. It is also important to consider the spread of mortality, or how unequal ages at death are in a population. Lifespan variation measures this inequality. For individuals, lifespan variation can be thought of as uncertainty in the timing of death. High lifespan variation means that we can be less certain of either reaching our life expectancy or living many years beyond that.
… and what is new about your approach compared to existing lifespan variation metrics?
M.N.: The key difference is this temporal perspective we talked about earlier on. Instead of measuring lifespan variation over one calendar year, which is the period approach, or over one birth year, which is the cohort approach, we are calculating the variation in ages at death of everyone born within the lifetime of the oldest person in the population.
Is your new metric applicable to mortality data of all kinds of countries?
M.N.: Yes, but it requires a long time series of data, usually covering at least around 100 years. Unfortunately, most countries haven’t been registering all births and deaths for such a long time period.
In your recent paper, you applied the metric to eleven European countries. What did you find?
A.v.R.: Yes, we did that. A ranking of these countries based on where women having the highest lifetime uncertainty looks like this: Italy, France, Scotland, Denmark, England and Wales, Finland, the Netherlands, Norway, Switzerland, Sweden.
M.N.: In general, we found that the cross-sectional average inequality in lifespan is declining steadily across all countries, meaning that ages at death are becoming increasingly similar over time, across generations. But the new temporal perspective shows just how different the exposure to mortality has been for people in different countries. Take Italy and Sweden, for example: if we compare their current death rates, we would see very similar levels of lifespan variation. But taking the broader lifetime perspective, Italians had the most varied ages at death and Swedes the least. Because death rates have declined very quickly in Italy, while in Sweden this process unfolded much more slowly.
Why are these findings important?
M.N.: Everyone forms expectations about the broad age range in which they expect to die. When these ages are narrow, it makes so many things in life easier—from retirement to family planning. But when we think we are as likely to die at age 50 as we are to survive to age 90, it introduces tremendous uncertainty into our life course.
Finally, an outlook: What possible applications do you see for your new method in the future?
A.v.R.: So far, we have only looked at national-level differences in this cross-sectional average inequality in lifespan, but this inequality is likely to also differ substantially across subnational groups. It’s long been known that people who feel to have little control over their lifetime are more likely to engage in risky behavior and less likely to engage in activities where the payoff is many years into the future. By creating a new metric that assesses lifetime exposure to varying ages at death, we hope to be able to eventually explain some of these differences across population groups.
Original Publication
Nepomuceno, M.R., Cui, Q., van Raalte, A., Aburto, J.M., Canudas-Romo, V.: The Cross-sectional Average Inequality in Lifespan (CAL†): A Lifespan Variation Measure That Reflects the Mortality Histories of Cohorts. Demography (2021) DOI: 10.1215/00703370-9637380
Authors and Affiliations
Marília R. Nepomuceno, Max Planck Institute for Demographic Research, Rostock
Qi Cui, Centre d'Estudis Demogràfics, Universitat Autònoma de Barcelona, Barcelona
Alyson van Raalte, Max Planck Institute for Demographic Research, Rostock
José Manuel Aburto, Leverhulme Centre for Demographic Science and Department of Sociology, University of Oxford; Interdisciplinary Center on Population Dynamics, University of Southern Denmark, Odense
Vladimir Canudas-Romo, School of Demography, Australian National University, Canberra