February 08, 2021 | Press Release
Visualize COVID-19 Excess Mortality in 38 Countries

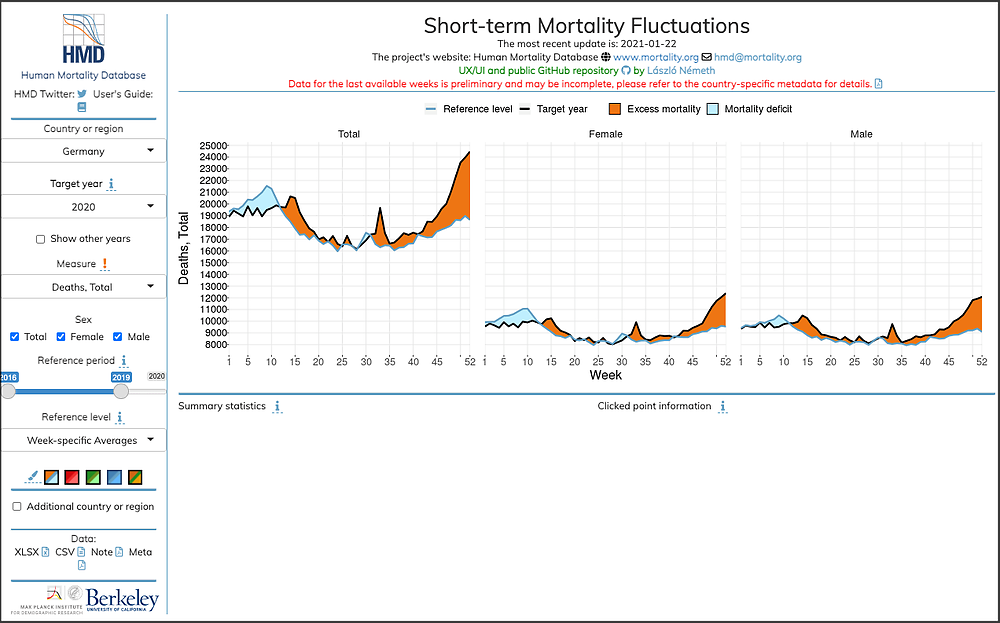
Screenshot of the STMF visualization toolkit for Germany. © STMF-Database
How many more people die every week during the COVID-19 pandemic compared to what was originally expected? This and related questions about the excess morality linked to COVID-19 are answered in the Short-Term Mortality Fluctuations (STMF) data series published by the Human Mortality Database (HMD) team. Additionally, it hosts an easily accessible and interactive online visualizing tool.
Currently, the STMF data series contains weekly death counts and death rates by age and sex for 38 countries and regions and is still growing. “We decided to add a visualization layer to the database to simplify access to the data,” says László Németh. In doing so, the research scientist and his colleagues want to enable users to explore the data, enhance the basic understanding, and stimulate research on mortality outbreaks and seasonal variations.
In their recently published paper in the journal PLOS One, the researchers explain the interactive visualization tool for excess mortality in detail.
The most reliable way to assess mortality elevation during the pandemic
Excess mortality helps to overcome data problems on causes of death that might result from differences in coding, approaches to testing, and a long delay of data release in different countries. Therefore, to estimate the excess deaths during epidemics, researchers rely on the difference between the observed and the expected number of deaths. “This method has been acknowledged by researchers and health authorities as the most reliable and objective way to assess mortality elevation caused by the COVID-19 pandemic,” says László.
The crucial challenge is to estimate the expected mortality pertaining to a given period. There are two major approaches: The first one, actively used to assess the COVID-19-related mortality, investigates the mortality deviations for certain weeks compared to the mortality of previous years. The second one focuses on the variation of mortality across weeks within a year and expresses a notion of seasonality.
STMF Visualization Toolkit
https://mpidr.shinyapps.io/stmortality/
Interactively access the length of an excess mortality polygon, summary information on death counts, and exceptional data point identification for 38 countries by week, sex, and broad age groups via the website.
STMF Database, Part of the Human Mortality Database
https://mortality.org
Original Publication
Németh, L., Jdanov, D.A., Shkolnikov, V.M.: An open-sourced, web-based application to analyze weekly excess mortality based on the Short-term Mortality Fluctuations data series. PLOS ONE. (2021) DOI: 10.1371/journal.pone.0246663
Authors and Affiliations
László Németh, Max Planck Institute for Demographic Research, Rostock
Dmitri A. Jdanov, Max Planck Institute for Demographic Research, Rostock
Vladimir M. Shkolnikov, Max Planck Institute for Demographic Research, Rostock